
DemandSense seamlessly integrates your LinkedIn Ads data with HubSpot or Salesforce, empowering you to track the impact of your campaigns on your sales pipeline and revenue. This powerful feature helps you track ad impact on deals, automate workflows, and optimize spending by excluding closed deals automatically. Whether you’re a B2B marketing manager evaluating ROI or an agency proving value to clients, DemandSense bridges the gap between LinkedIn’s basic reporting and your CRM’s deal data.
This guide walks you through setting up and leveraging your CRM integration within the DemandSense platform, highlighting key features, setup steps, and use cases to maximize ROI and align sales and marketing teams.
Getting Started: Connecting Your CRM #
To begin using DemandSense’s CRM integration, connect your HubSpot or Salesforce account within the platform. Note that you can only connect one CRM (HubSpot or Salesforce) at a time. To switch CRMs, disconnect the current one first by clicking “Disconnect.”
- Navigate to Settings:
- Log in to DemandSense and click on the gear icon in the bottom left to open the Settings menu.
- Select “Integrations” from the submenu.
- Connect Your CRM:
- Under “CRM Connection,” you’ll see options for HubSpot and Salesforce.
- Click “Connect” next to your chosen CRM.
- Follow the prompts to authorize access. For HubSpot, this involves logging into your HubSpot account and granting permissions. For Salesforce, enable the DemandSense External Client App for secure data syncing.
- Once connected, the status will update to “Connected.” If needed, use the “Disconnect” button to remove the integration.

After connecting, DemandSense will sync LinkedIn Ads data (impressions, clicks, engagements) with your CRM’s Companies and Deals. Data updates weekly, focusing on deals tied to companies exposed to your ads.
Benefits of CRM Integration #
By linking your CRM, DemandSense provides actionable insights beyond LinkedIn’s native reporting, which often misses impressions and the full B2B buyer journey. Key benefits include:
- Influenced Pipeline Insights: Visibility into which companies in your CRM were exposed to LinkedIn Ads before deals were created or closed—giving a clear view of campaign impact across all stages of the funnel.
- Attribution and ROI Measurement: A clearer understanding of how LinkedIn Ads contribute to deal creation and revenue—even when conversions aren’t directly attributed—supporting better budget justification and performance evaluation.
- Automation and Optimization: Trigger outbound workflows based on engagement and automatically exclude companies with closed deals (won or lost) from LinkedIn ad targeting to reduce wasted spend.
- Sales and Marketing Alignment: Provide both teams with real-time visibility into ad engagement, enabling better collaboration and more effective targeting.
- Enhanced Reporting: Build “influenced revenue” reports to demonstrate the true value of LinkedIn Ads, even when conversions aren’t directly attributed to ads.
Note: DemandSense ties LinkedIn Ads data to Deals and Companies in your CRM, focusing on deals associated with companies. Currently, companies without associated deals are not included, but support for this functionality is planned in future updates to improve match rates.
How It Works #
DemandSense Revenue Attribution connects your LinkedIn paid ads and organic activity directly to your CRM deals in HubSpot or Salesforce. It shows you exactly which accounts your LinkedIn efforts influenced, how much pipeline and closed-won revenue they generated, which campaigns performed best, and the complete buyer journey from first touch to deal close.
The module has five tabs: Overview, Accounts, Campaigns, Journeys, and Settings. All tabs except Settings share the same top filter bar where users can define the Reporting Period and Lookback Window, allowing attribution analysis across different time ranges. Additional filters such as Account Status, Campaign, and other segmentation controls enable users to narrow the analysis to specific subsets of influenced accounts.
All metrics and visualizations on the page automatically update based on the selected filters.
Overview Tab – Quick Executive Summary #
This is your main dashboard. It answers at a glance: “Is our LinkedIn marketing actually generating revenue?”
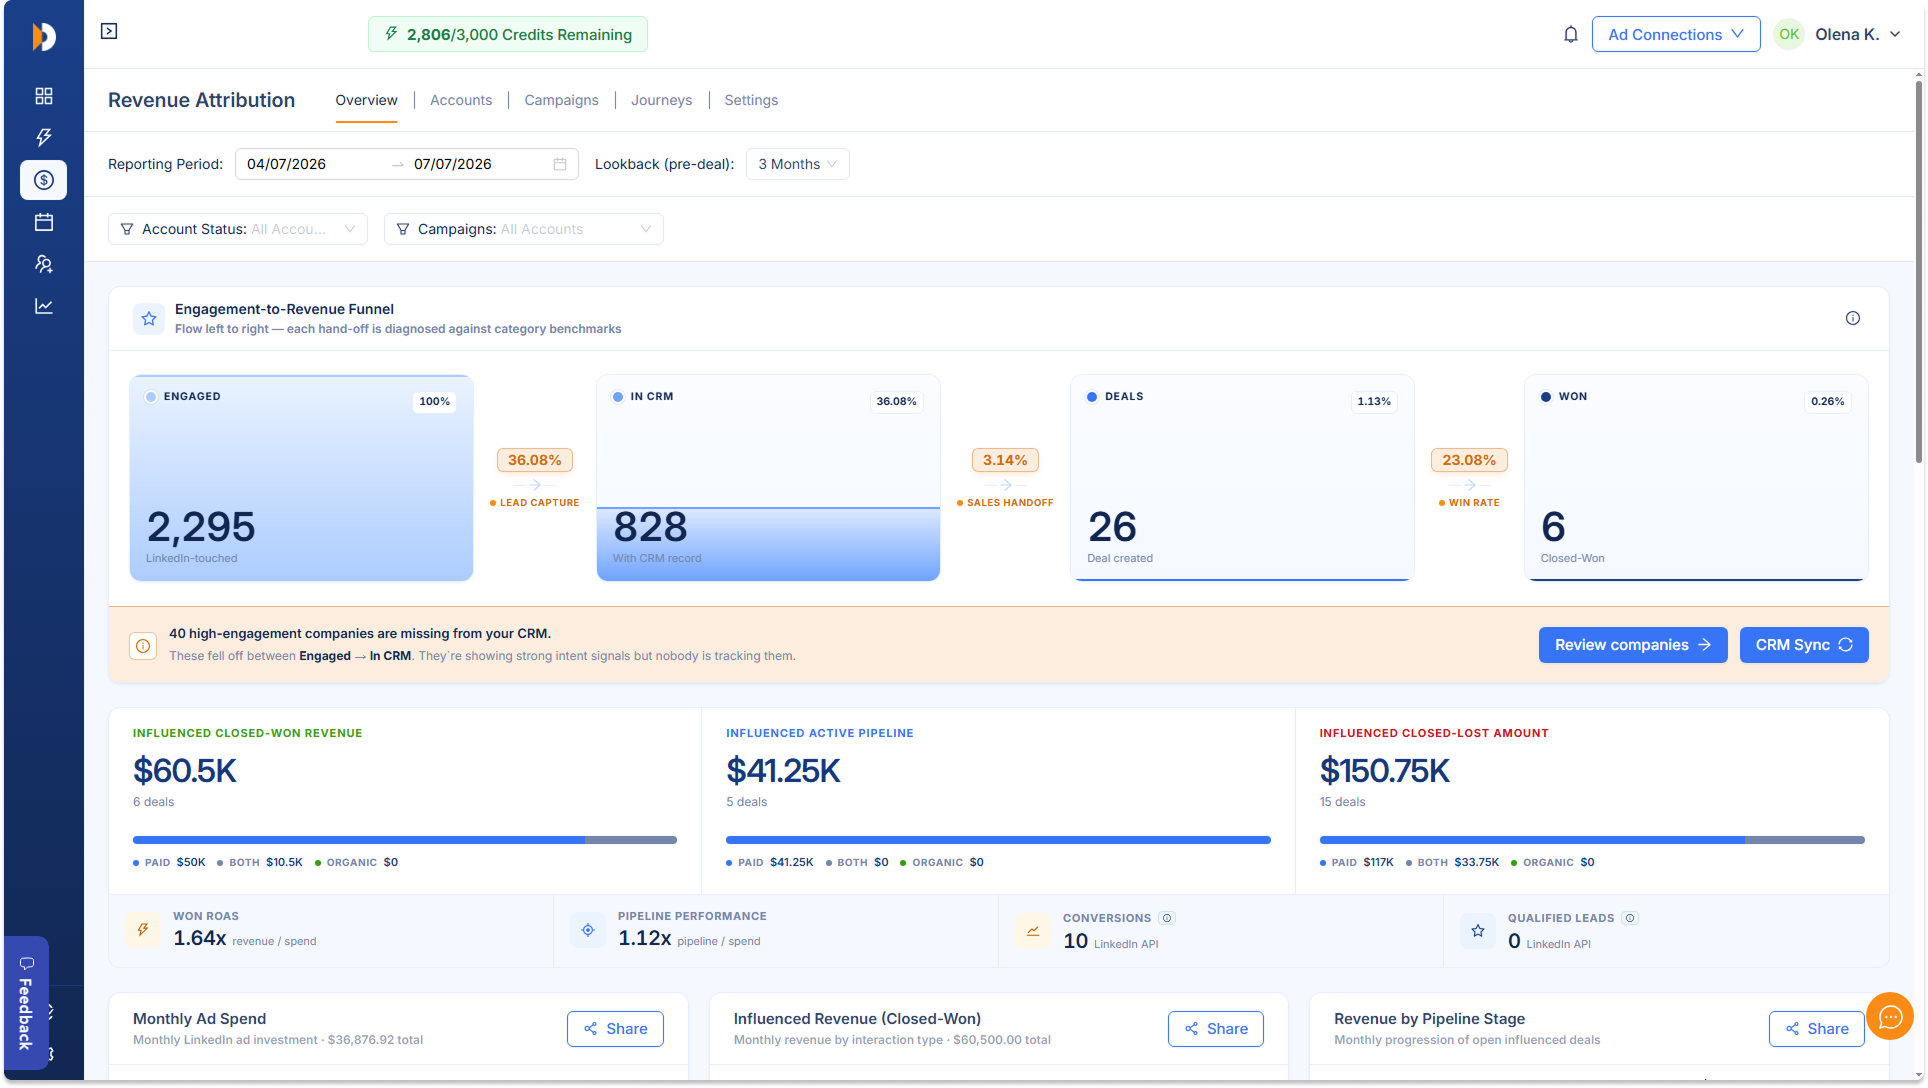
Engagement-to-Revenue Funnel
The funnel provides a visual representation of how accounts progress from initial engagement to closed revenue. The funnel also highlights conversion percentages between each stage, helping teams identify bottlenecks such as:
- Low CRM capture rates
- Poor sales handoff efficiency
- Low deal-to-win conversion rates
Engaged
Represents all companies that generated qualifying LinkedIn engagement during the selected reporting period. These engagements may include:
- Ad impressions
- Clicks
- Website visits
- Content interactions
- Other tracked LinkedIn touchpoints
This stage establishes the total population of influenced accounts entering the funnel.
In CRM
Shows the number of influenced companies that also exist in the connected CRM and were created within the selected reporting period.
The conversion percentage between Engaged and In CRM indicates how effectively marketing engagement is translating into identifiable sales opportunities.
Deals
Represents influenced CRM accounts that progressed into an opportunity or deal stage.
The conversion rate from In CRM to Deals helps evaluate the effectiveness of lead qualification and sales handoff processes.
Won
Displays deals that ultimately reached a Closed-Won status.
This final stage demonstrates how many LinkedIn-influenced accounts successfully converted into revenue-generating customers.
Opportunity Gap
Located directly below the funnel, the Opportunity Gap section identifies engaged companies that are demonstrating meaningful buying intent but have not yet been captured within the CRM.
These organizations have generated significant LinkedIn engagement but currently lack corresponding CRM records.
This widget helps revenue teams:
- Discover missed pipeline opportunities
- Identify accounts requiring outreach
- Improve CRM coverage
- Reduce leakage between marketing and sales
The accompanying call-to-action allows users to review these companies and initiate CRM synchronization where appropriate.
Primary Revenue Metrics
These KPIs provide a summary of attributed business outcomes.
Influenced Closed-Won Revenue
Displays the total revenue generated from Closed-Won deals that had qualifying LinkedIn activity before deal creation. This metric represents the clearest indicator of marketing contribution to revenue and includes both revenue amount and associated deal count.
Influenced Active Pipeline
Measures the value of currently open opportunities that were influenced by LinkedIn activity before being created in the CRM.
This KPI provides visibility into future revenue potential and helps quantify marketing’s contribution to pipeline generation.
Influenced Closed-Lost Amount
Shows the total value of opportunities that ultimately closed as lost despite having qualifying LinkedIn engagement.
Comparing closed-lost value against closed-won revenue helps assess overall conversion efficiency and identify potential qualification issues.
Efficiency Metrics
The dashboard includes a set of efficiency-focused indicators that place revenue outcomes into the context of marketing investment.
Won ROAS
Return on Ad Spend for Closed-Won opportunities.
Formula: Closed-Won Revenue ÷ Ad Spend
This metric measures how much revenue was generated for every advertising dollar spent.
Pipeline Performance
Measures the amount of influenced pipeline generated relative to advertising investment.
Formula: Influenced Active Pipeline ÷ Total Ad Spend
A higher value indicates stronger pipeline generation efficiency.
Conversions
Displays the number of attributed conversion events generated during the selected reporting period.
These conversions represent meaningful actions captured through LinkedIn attribution and contribute to account influence calculations.
Qualified Leads
Displays the number of accounts that meet qualification thresholds based on Company Intelligence metrics and attribution criteria.
This metric helps identify organizations demonstrating sufficient buying intent to warrant sales engagement.
Revenue Trend Analysis
The next section provides month-over-month performance visualization.
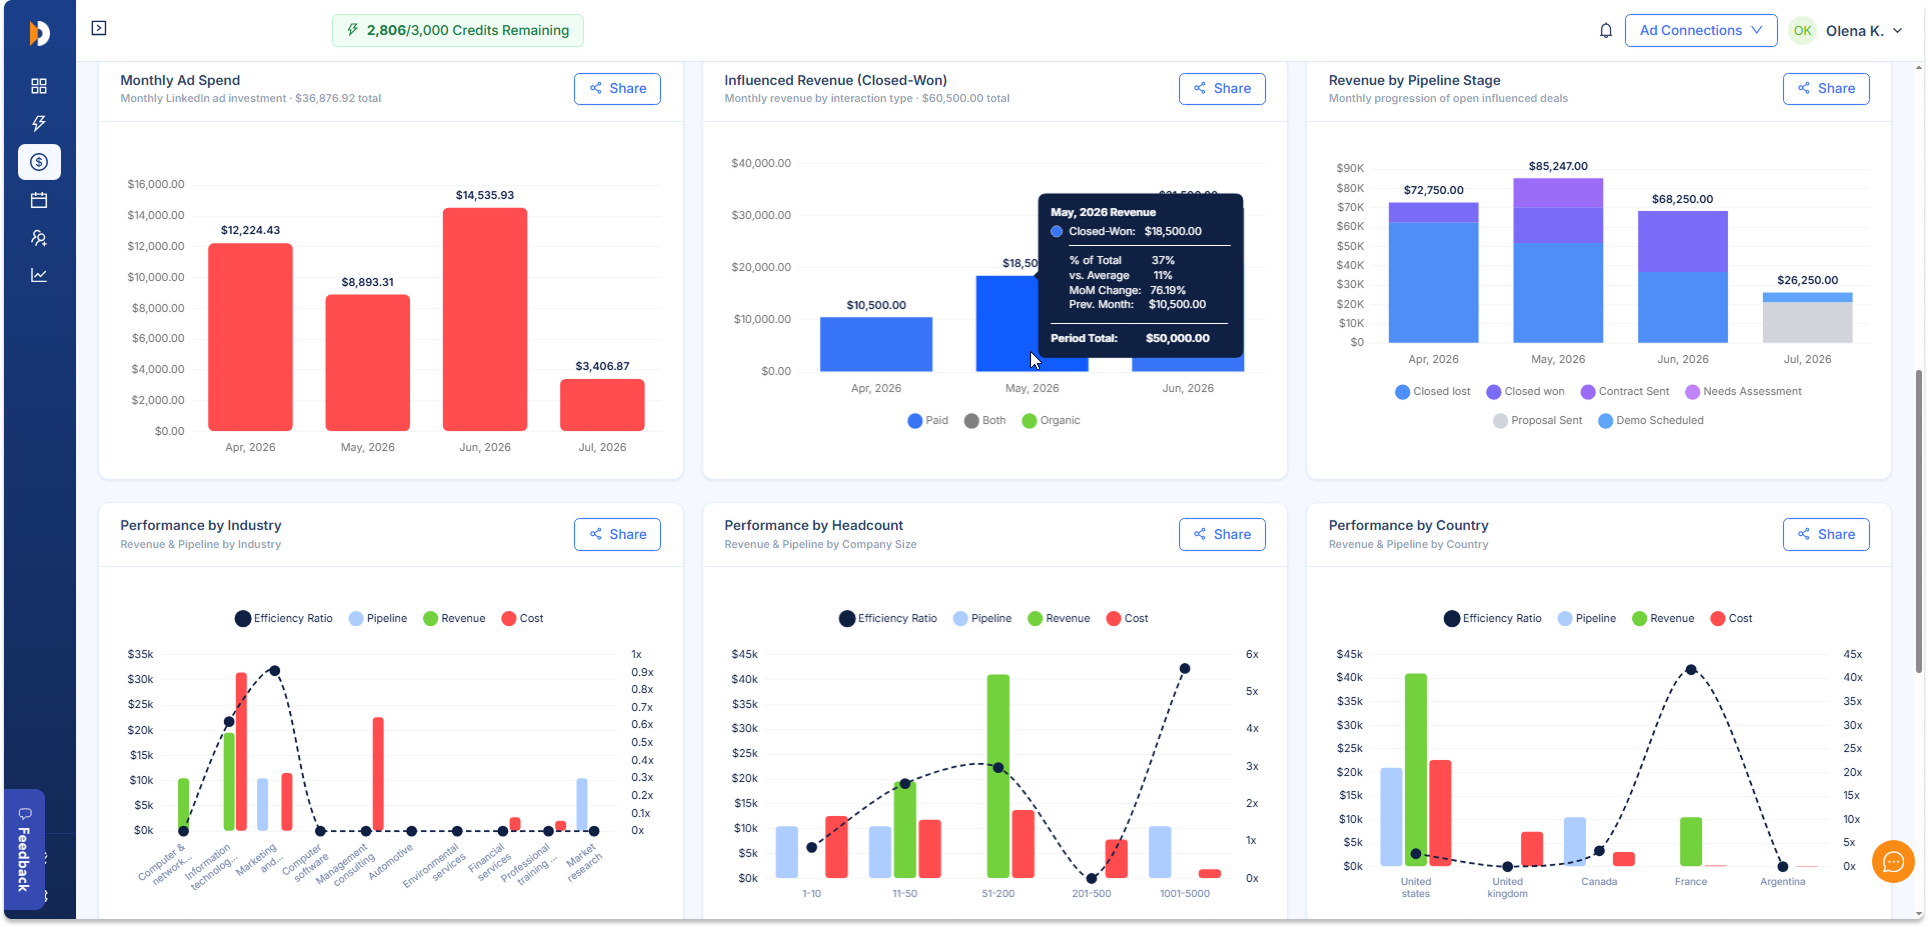
Monthly Ad Spend
A monthly breakdown of LinkedIn advertising investment.
The chart helps users understand spending patterns and determine whether marketing investment is increasing, decreasing, or remaining stable over time.
Users can compare spend trends against revenue and pipeline outcomes shown in adjacent charts.
Influenced Revenue (Closed-Won)
Displays monthly revenue generated from influenced accounts that progressed to Closed-Won status. This visualization highlights:
- Strong-performing periods
- Revenue acceleration trends
- Seasonal fluctuations
- Revenue concentration by month
Revenue by Pipeline Stage
A stacked view of pipeline value distributed across sales stages. Typical stages include:
- Needs Assessment
- Demo Scheduled
- Proposal Sent
- Contract Sent
- Closed Won
- Closed Lost
This chart helps determine whether influenced pipeline is progressing through the sales process or becoming concentrated in early-stage opportunities.
Performance by Segment
The Overview tab also includes several segmentation views that reveal where marketing performs best.
Performance by Industry
Compares revenue, pipeline, cost, and efficiency across industries. This view helps identify:
- High-converting verticals
- Industries generating the strongest revenue
- Segments delivering the best return on investment
Organizations can use these insights to refine targeting and budget allocation strategies.
Performance by Headcount
Evaluates performance by company size. By comparing revenue and efficiency across employee-count ranges, users can identify the company size segments most responsive to LinkedIn marketing efforts.
Performance by Country
Provides a geographic breakdown of influenced revenue, pipeline, and efficiency metrics. This view helps marketers understand:
- Which regions generate the strongest results
- Where pipeline concentration exists
- Opportunities for regional budget optimization
Opportunity Gap Table
The detailed Opportunity Gap table expands upon the summary alert shown below the funnel. For each company, the table provides information such as:
- Company name
- Industry
- Paid engagement activity
- Organic engagement activity
These accounts have demonstrated engagement but have not yet become CRM opportunities. This table serves as a prioritized prospecting list for sales and business development teams.
Rising Accounts
The Rising Accounts widget identifies companies experiencing a meaningful increase in engagement compared to previous periods. The comparison is typically based on recent activity. These organizations may be:
- Entering active buying cycles
- Increasing research activity
- Returning to evaluate solutions
- Demonstrating stronger intent signals
By surfacing these accounts automatically, the widget helps teams focus outreach efforts on companies showing the highest likelihood of conversion.
Accounts Tab – View Every Influenced Account #
This tab lists all accounts that LinkedIn influenced according to your attribution rules.
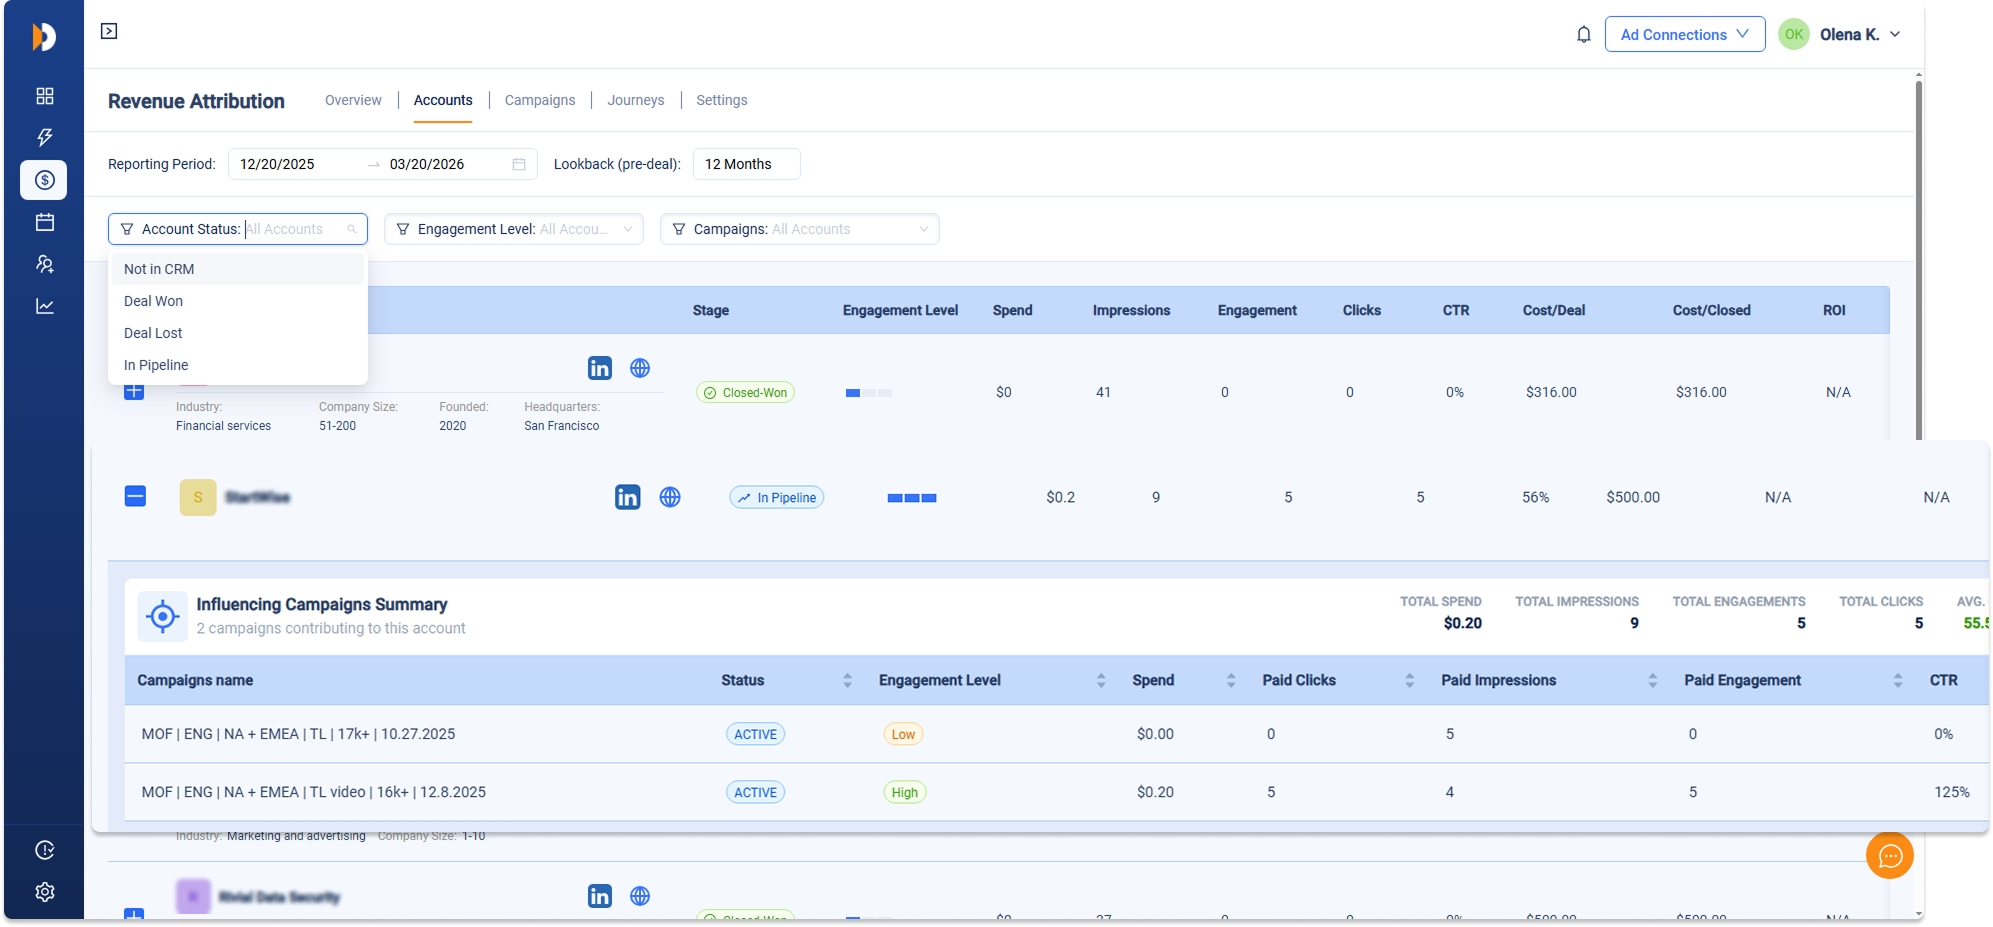
Each row includes
- Account name with LinkedIn and website icons, plus basic company info (industry, company size, founded year, headquarters)
- Current CRM Stage with color-coded badge (Closed-Won, In Pipeline, etc.)
- Engagement Level shown as a visual blue bar indicator
- Key LinkedIn metrics: Spend, Impressions, Engagements, Clicks, CTR
- Cost/Deal (total ad spend if a deal exists)
- Cost/Closed (total ad spend if the deal is closed)
- ROI (calculated only for Closed-Won deals)
- Outcome column showing deal details such as close date and deal amount (or pipeline stage and creation date)
How to use it:
- Click any row to open a detailed side drawer with four tabs: Summary, Journey, Attribution, and Activate.
- Summary—Explains why the account is considered influenced and shows key facts (stage, deal amount, dates, first LinkedIn touch, total spend, website sessions).
- Journey—Displays the full visual timeline of LinkedIn activity, website visits, and CRM events.
- Attribution—Shows how credit for the deal is distributed across channels and lets you switch between First Touch, Last Touch, or Linear models.
- Activate—Context-sensitive actions: create the account in HubSpot, sync active pipeline accounts to LinkedIn audiences, or exclude closed accounts from future LinkedIn targeting. (These drawer tabs are planned for a future release.)
- Click the blue + icon on the left of any row to expand it and view the Influencing Campaigns Summary—this shows all specific campaigns that contributed to influencing that account, along with per-campaign metrics (status, engagement level, spend, paid clicks, impressions, engagements, and CTR).
- Bulk actions (export selected accounts, exclude from audiences, or sync to audiences), advanced sorting, and additional filtering options are planned for future releases.
Campaigns Tab – Evaluate Campaign Performance #
This tab helps you understand which of your LinkedIn campaigns are actually driving revenue—not just generating impressions or clicks.
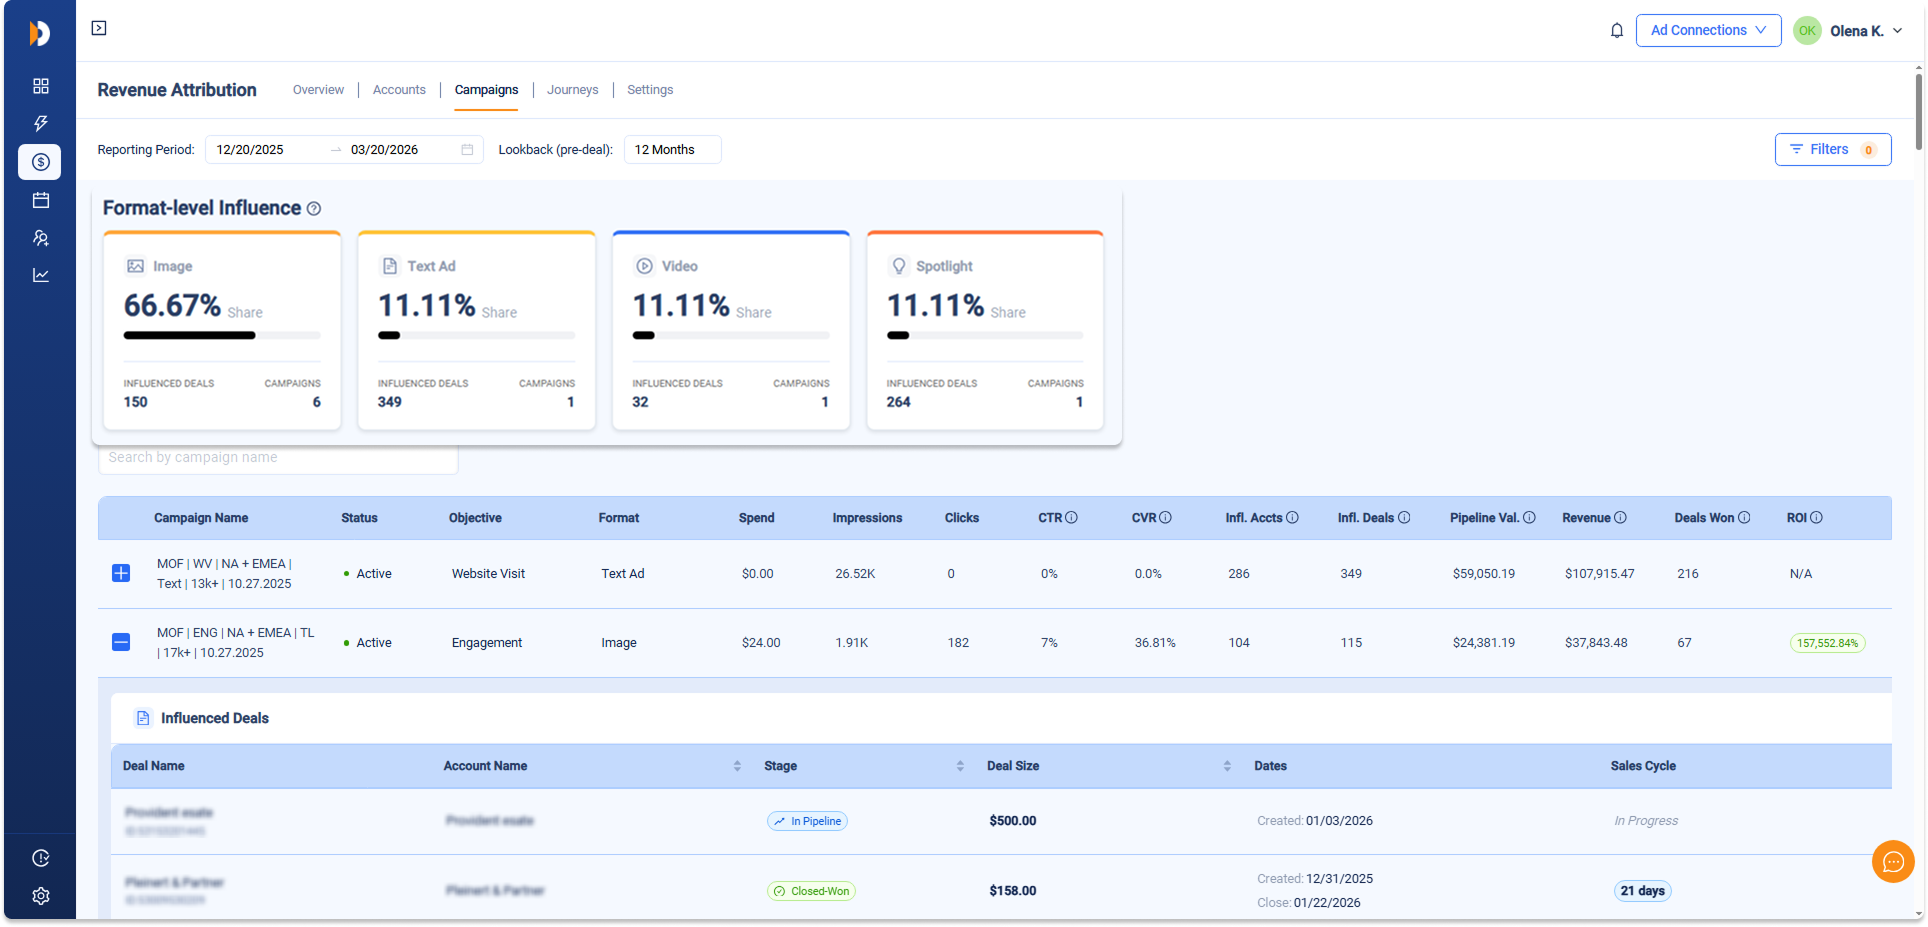
At the top of the tab you’ll see four cards showing Format-level Influence. These cards display how different ad formats (Image, Text Ad, Video, Spotlight, etc.) contribute to your influenced deals across the selected period.
Each card shows:
- The ad format name
- Share percentage of total influence
- Number of Influenced Deals
- Number of Campaigns using that format
Tip: Higher influence share does not always mean better performance—it simply means that the format appears more often or more meaningfully in buyer journeys.
The main table below the Format-level Influence cards lists all your LinkedIn campaigns. Each row shows essential performance data, including
- Campaign name and current status (Active, Paused, etc.)
- Objective and ad format
- Core ad metrics (Spend, Impressions, Clicks, CTR, CVR)
- Influence results (Influenced Accounts, Influenced Deals)
- Revenue impact (Pipeline Value and Closed-Won Revenue)
How to dig deeper:
- Click the blue + icon on the left of any campaign row to expand it.
- This reveals the Influenced Deals sub-table, showing the specific deals that the campaign influenced, with details like deal name, account, stage, size, dates, and sales cycle length.
Quick tips:
- Use the search bar (“Search by campaign name”) to filter quickly.
- Click the Filters button (top right) for advanced options like Deal Amount Range.
Journeys Tab – See the Full Buyer Journey #
This tab visualizes how accounts interact with your brand over time across LinkedIn ads.
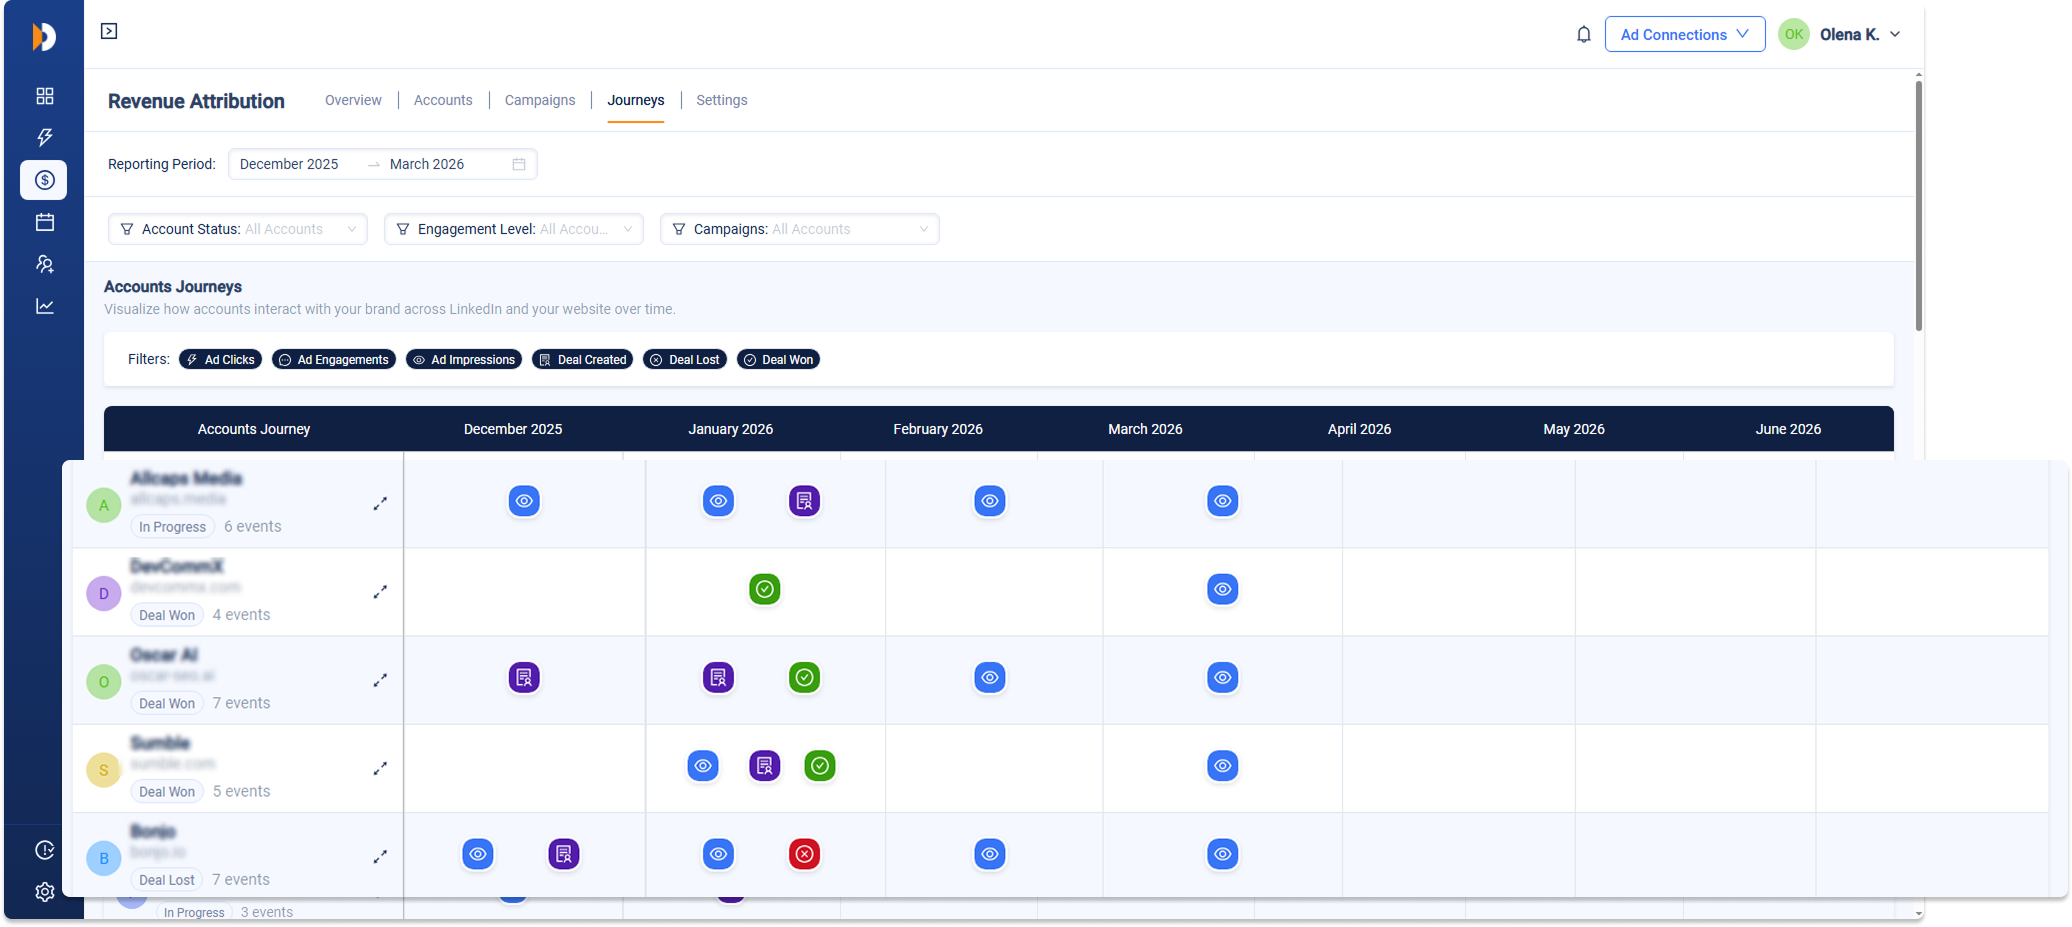
You’ll see a timeline view where each row represents one account. Colored icons show different events:
- Blue eye = Ad Impressions
- Lightning bolt = Ad Engagements (likes, comments, clicks)
- Purple marker = Deal Created
- Green check = Deal Won
- Red X = Deal Lost
Use the event filters at the top (Ad Clicks, Ad Engagements, Ad Impressions, Deal Created, Deal Lost, Deal Won) to show or hide specific touchpoints.
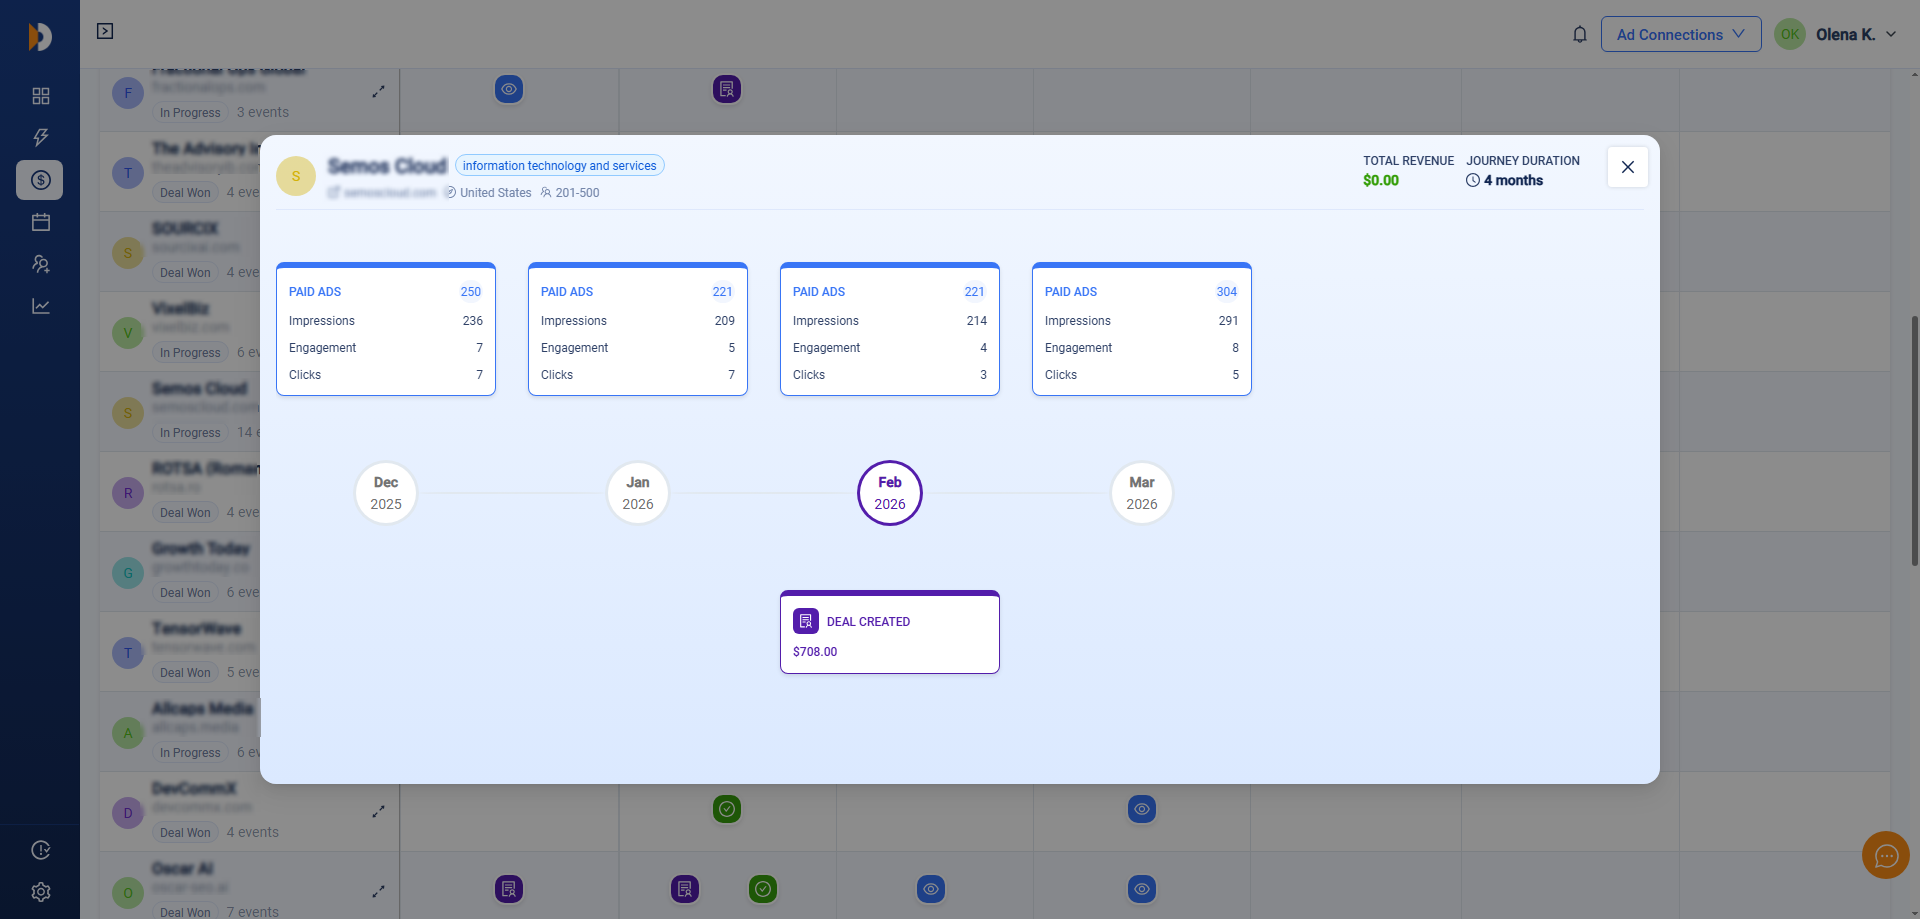
Click the small arrow next to any account to open a more detailed view of its complete journey timeline.
Settings Tab – Configure How Attribution Works #
This is where you define the rules and automations for the entire module.
Attribution Logic
Choose from three preset models:
- Awareness – Best for brand visibility (credits accounts that saw your ads/content multiple times)
- Engagement – Best for measuring resonance (credits likes, comments, etc.)
- Intent – Best for high-intent signals (clicks + website visits)
Or create a Custom Model by toggling individual criteria (Paid Impressions, Paid Clicks, Paid Engagements, etc.) and setting your own minimum thresholds.
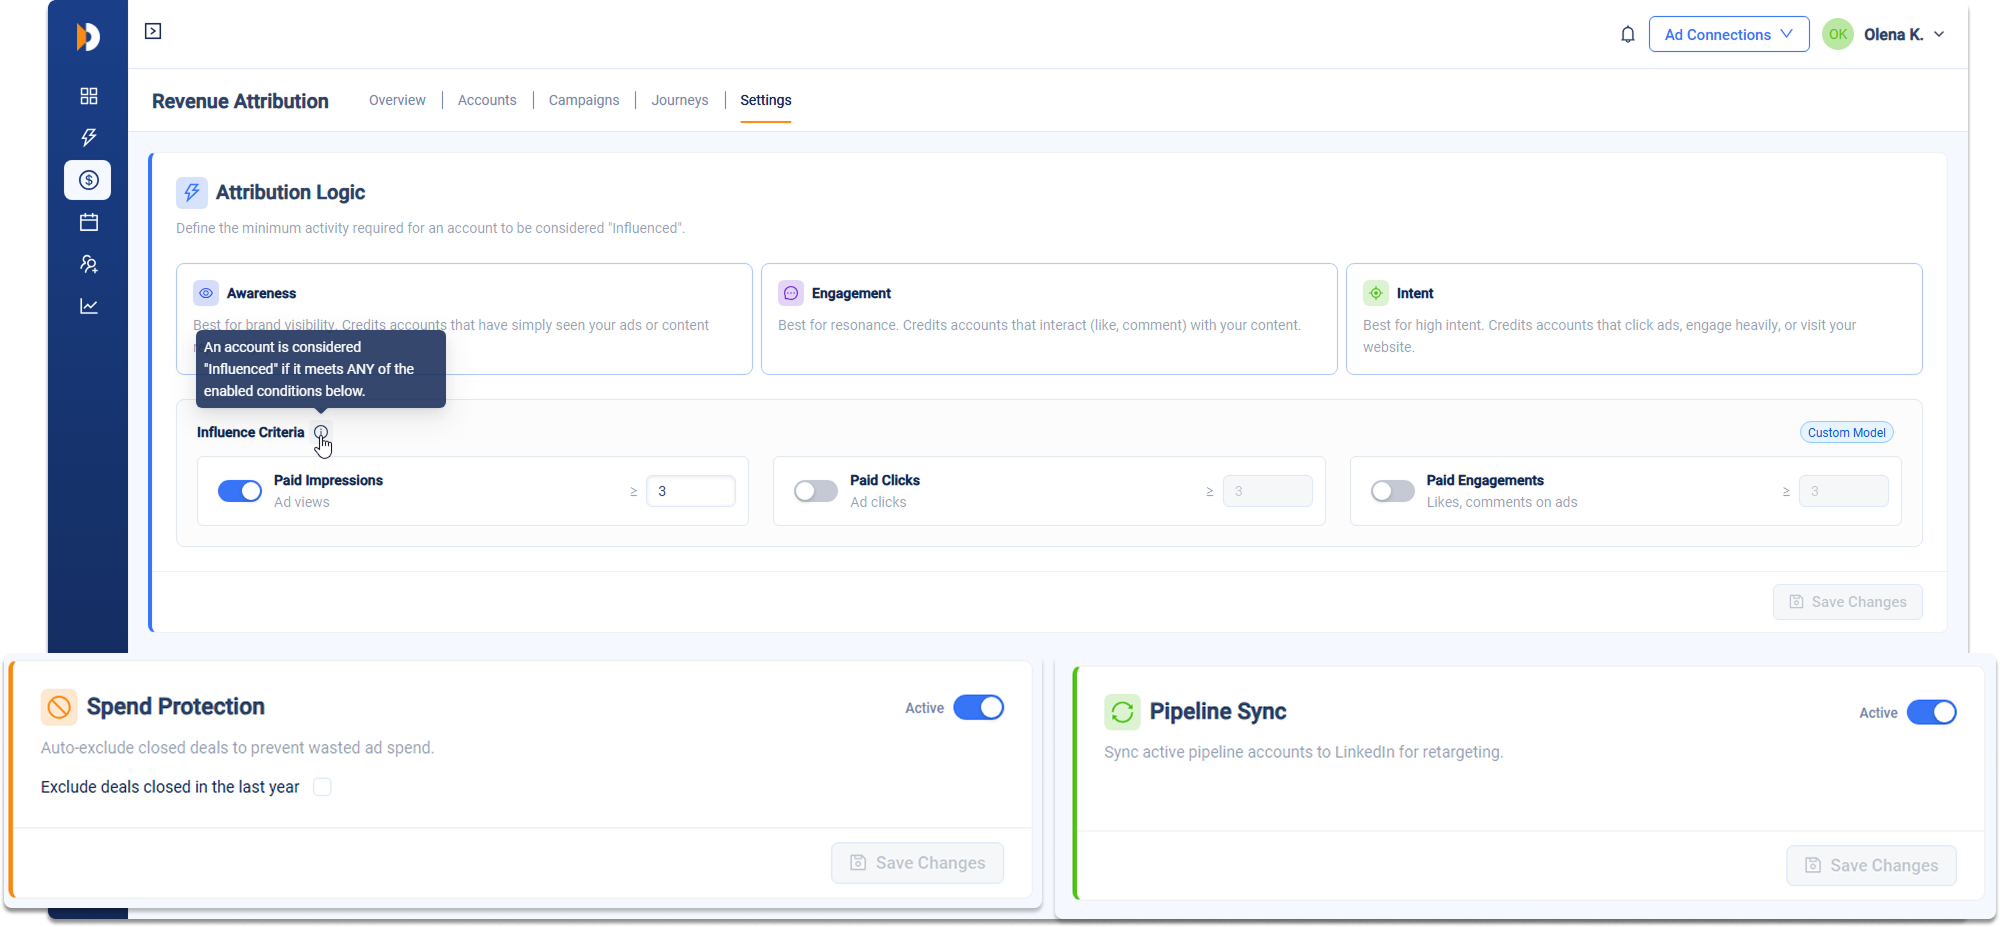
Automations
- Spend Protection—Automatically excludes accounts with closed deals (won or lost) from your LinkedIn audiences to avoid wasting ad spend.
- Pipeline Sync—Automatically syncs your active pipeline accounts to LinkedIn audiences for better retargeting and nurturing.
Both automations can be turned on/off. You can also choose the lookback period for exclusions.
Quick Start Tips #
- Start on the Overview tab to get the big picture and see your overall ROI.
- Go to Accounts to investigate specific companies and take action.
- Use Campaigns to decide which campaigns to scale or pause.
- Check Journeys to understand typical buyer behavior, spot patterns, and improve your content sequencing
- Adjust rules and turn on automations in Settings to fine-tune results.
This new version of Revenue Attribution transforms LinkedIn from a vanity-metric channel into a true revenue driver with clear attribution, actionable insights, and helpful automations. Start exploring the tabs today!
Frequently Asked Questions #
#
CRM Integration FAQ #
Does DemandSense support both HubSpot and Salesforce?
Yes, the platform supports both HubSpot and Salesforce, and you can use one at a time.
How does DemandSense differ from LinkedIn’s native integrations?
LinkedIn’s native integrations (e.g., HubSpot’s ad sync or Salesforce’s Sales Navigator) focus on clicks and conversions. DemandSense provides deeper insights into impressions and engagements, tracking the full B2B buyer journey and enabling influenced revenue reporting.
How often does DemandSense sync data?
Data syncs weekly, with auto-exclusion and auto-inclusion updates running every Friday by 11:55 PM UTC.
Can I exclude closed deals from LinkedIn Ads?
Yes, enable “Auto-Exclusion” to automatically downvote companies with closed deals, updating the exclusion list weekly.
Can I target active pipeline companies?
Yes, enable “Auto-Inclusion” to create and update a LinkedIn custom audience of active pipeline companies weekly.