
Managing your advertising campaigns is easier with the right insights, and that’s where our Reporting & Analytics feature comes in. This guide will help you navigate the reporting options available, explain the different templates, and show you how to generate and customize reports based on your needs.
To access the Reporting & Analytics section, follow these steps:
- Navigate to Settings in the bottom left corner.
- Select User Settings from the dropdown menu.
- In the User Settings page, locate and click on the Reporting & Analytics tab.
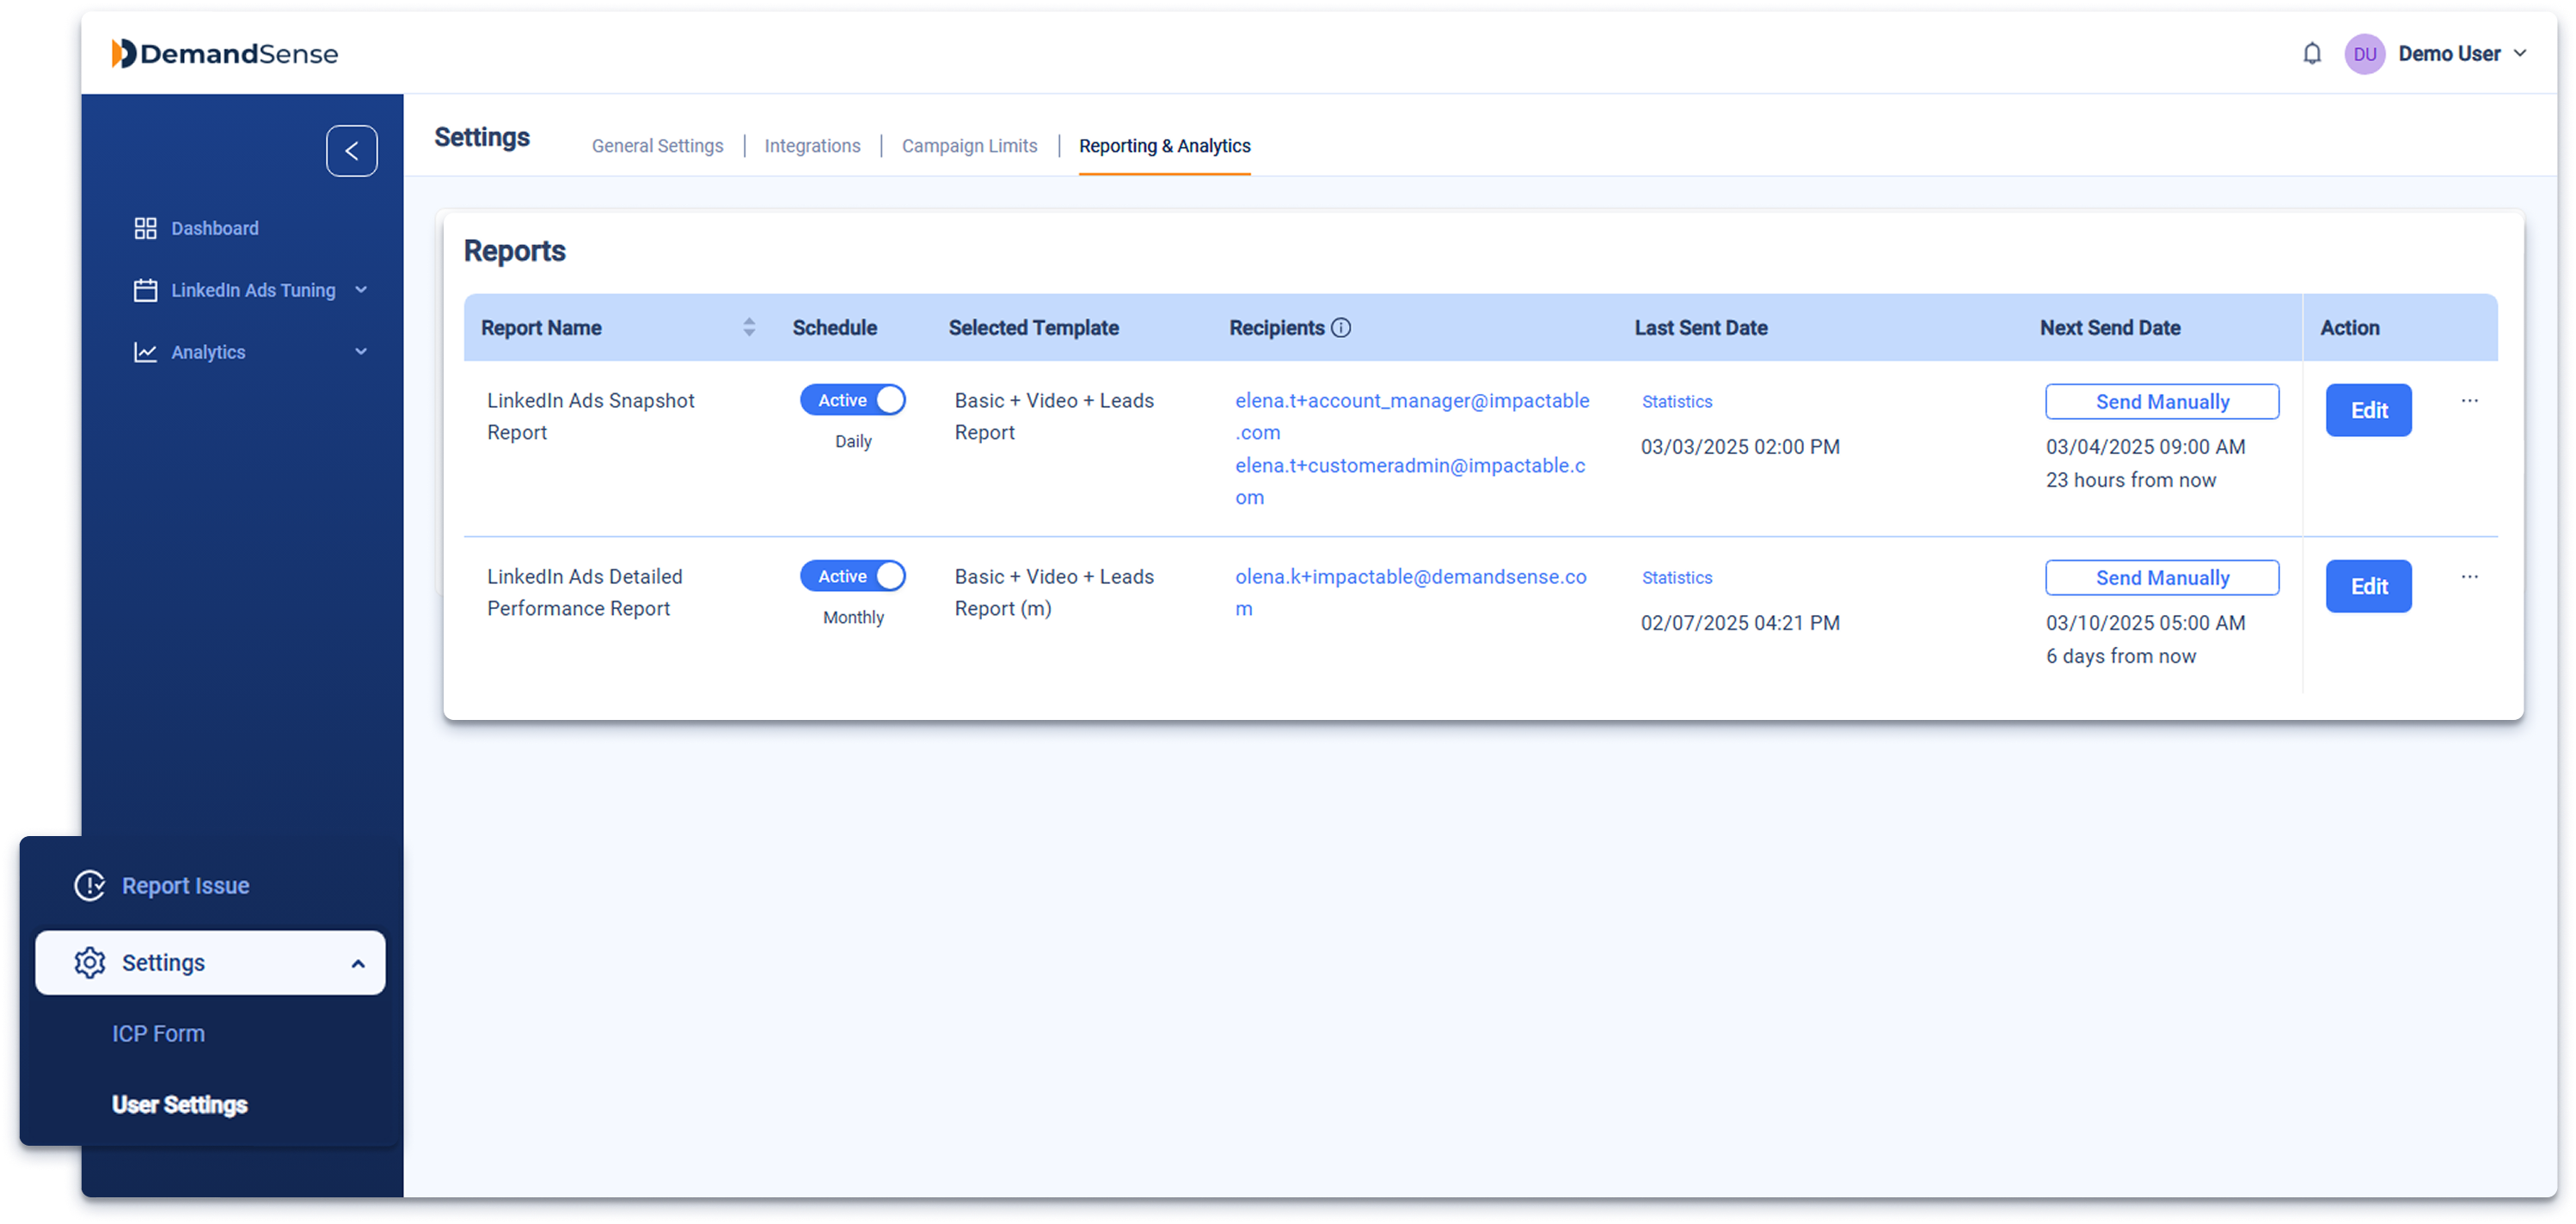
Once you’re in the Reporting & Analytics section, you will see a table with the following columns:
- Report Name: The specific report being viewed/generated.
- Schedule: Indicates if the report is automatically sent regularly (e.g., Daily, Weekly, Monthly).
- Selected Template: The layout of the report, including various metrics.
- Recipients: Users who have received the report.
- Last Sent: The last time the report was sent, including performance stats (e.g., open rates, click rates).
- Next Send Date: The date for the next scheduled report delivery.
- Action: Allows you to manage or edit the report, such as changing the schedule or recipients.
Types of Reports #
We offer two main types of reports, each designed to suit different reporting needs. Both report types come with four supported templates, allowing you to choose the best fit for your goals. Here’s a breakdown of each type:
- LinkedIn Ads Detailed Performance Report
This comprehensive report provides an in-depth analysis of all relevant metrics, including secondary metrics and demographic breakdowns. It’s perfect for those who need detailed insights into campaign performance over a longer period. This report is ideal for monthly or bi-weekly reporting and helps you evaluate your LinkedIn Ads performance at a granular level. Use it for thorough analysis, such as assessing the effectiveness of different audience segments or ad creatives. - LinkedIn Ads Snapshot Report
The Snapshot Report offers a quick overview of key performance metrics, focusing on essential trends. It’s best suited for clients or teams who need regular, high-level updates without diving too deep into the data. Typically used for weekly or bi-weekly reporting, this report gives you a fast snapshot of your campaign’s performance, making it ideal for tracking overall trends and making timely adjustments.
Each report type can be customized by choosing one of these templates (8 variations in general) to match your specific needs:
- Basic Report
This variant includes all the essential metrics needed to track the overall performance of your campaigns. It’s perfect for those who want a simple overview of how their campaigns are performing. - Basic + Video Report
If your campaigns include video ads, this variant provides all the essential metrics, plus additional video-specific metrics like views and video engagement. Use this variant when you want to evaluate the performance of your video ads alongside your regular metrics. - Basic + Leads Report
This variant includes all essential metrics, plus additional insights into lead form submissions for lead generation campaigns. It’s useful when you’re running lead generation campaigns and want to track form submissions and related actions. - Basic + Video + Leads Report
This all-in-one variant combines all the essential metrics with both video ads-related and lead form-related metrics. It’s ideal when you’re running campaigns with video ads and lead generation forms, and you want a comprehensive view of performance across all aspects of your campaigns.
These templates allow you to tailor your reports to match the specific aspects of your campaigns, whether it’s video performance, lead generation, or a combination of both.
Matching Reports to Your Marketing Funnel Stages #
In a marketing funnel context, TOF (Top of Funnel), MOF (Middle of Funnel), and BOF (Bottom of Funnel) represent different stages in the customer journey. Here’s how each report type could be matched to these stages based on the ad strategy and metrics focus:
- TOF (Top of Funnel) – This stage is about generating awareness and attracting potential customers. The focus is on reaching a broad audience and introducing them to the brand or product.
Fitting Reports:- Basic Report: This includes essential metrics like impressions, reach, and engagement, which help in understanding how effectively the campaign is reaching and engaging a wide audience.
- Basic + Video Report: If video ads are part of the strategy, adding video-specific metrics such as views and engagement helps measure brand awareness and audience interest.
- MOF (Middle of Funnel) – At this stage, the focus shifts to nurturing leads and moving them closer to conversion. The campaign may become more targeted, often encouraging specific actions from the audience, such as clicks or form submissions.
Fitting Reports:- Basic + Video Report: This is ideal for monitoring how well the campaign is continuing to engage the audience through video, while also keeping track of engagement metrics.
- Basic + Leads Report: If lead generation is a key objective, this report provides insights into how well the campaign is performing in terms of lead form submissions and other actions indicative of interest.
- BOF (Bottom of Funnel) – The focus here is on driving conversions and sales, targeting those who are already familiar with the brand and have shown strong intent.
Fitting Reports:- Basic + Leads Report: If the campaign is focused on lead generation, tracking lead form submissions and related metrics is essential for evaluating the effectiveness of the strategy at this stage.
- Basic + Video + Leads Report: If video ads are being used for retargeting alongside lead generation tactics, this comprehensive report provides a full view of both video engagement and lead form submissions.
Each stage of the funnel benefits from a tailored report that aligns with the goals of that specific stage. This ensures that the right metrics are being tracked and analyzed for optimizing ad performance.
How to Schedule and Customize Your Reports #
When it comes to reporting, there are multiple approaches available to meet varying needs and preferences. Depending on the level of detail required and the frequency of updates, you can choose between automated scheduling or triggering reports manually. Automated reporting is ideal for streamlined, regular updates, while manual reporting offers more customization and flexibility for specific data sets. Below, we’ll explore both options in detail, outlining when and why each might be the best choice for your reporting needs.
Automating Your Reports for Regular Updates #
If you prefer receiving regular updates without having to manually generate reports, you can automate your reports to be sent on a daily, weekly, bi-weekly, or monthly basis. This ensures consistency and saves you time. To edit a scheduled report, click the Edit button in the Action column. This will open the Edit Report popup, where you can adjust the following fields:
- Selected Template: Choose the report template you’d like to use.
- Dashboard Preview Link: View a preview of the report as it will appear when sent. The preview will reflect the most recent appropriate period.
- Selected Campaign Groups: Choose specific campaign groups to include.
- Selected Campaigns: Narrow down the report to particular campaigns within the selected group.
- Subject: Set the subject line for the email.
- Message: Add a personalized message to the report.
- Signature: Include a signature to close the report.
- Reply To: Set the reply-to email address.

You can also adjust the following:
- Change the Frequency: Reports can be scheduled to send daily, weekly, bi-weekly, or monthly, or paused altogether.
- Select the Exact Timing: Choose the day of the week, occurrence in the month, and specific time for when the report should be sent.
Additionally, you can add recipients by specifying:
- Send To: Primary recipient(s) who will receive the report.
- Send CC: Additional recipients who will also receive the report.
- Also Send To Emails: Add email addresses of people not registered as users in DemandSense.
By customizing these fields, you can create highly personalized, automated reports that are sent exactly when and how you want.
Triggering Manual Report #
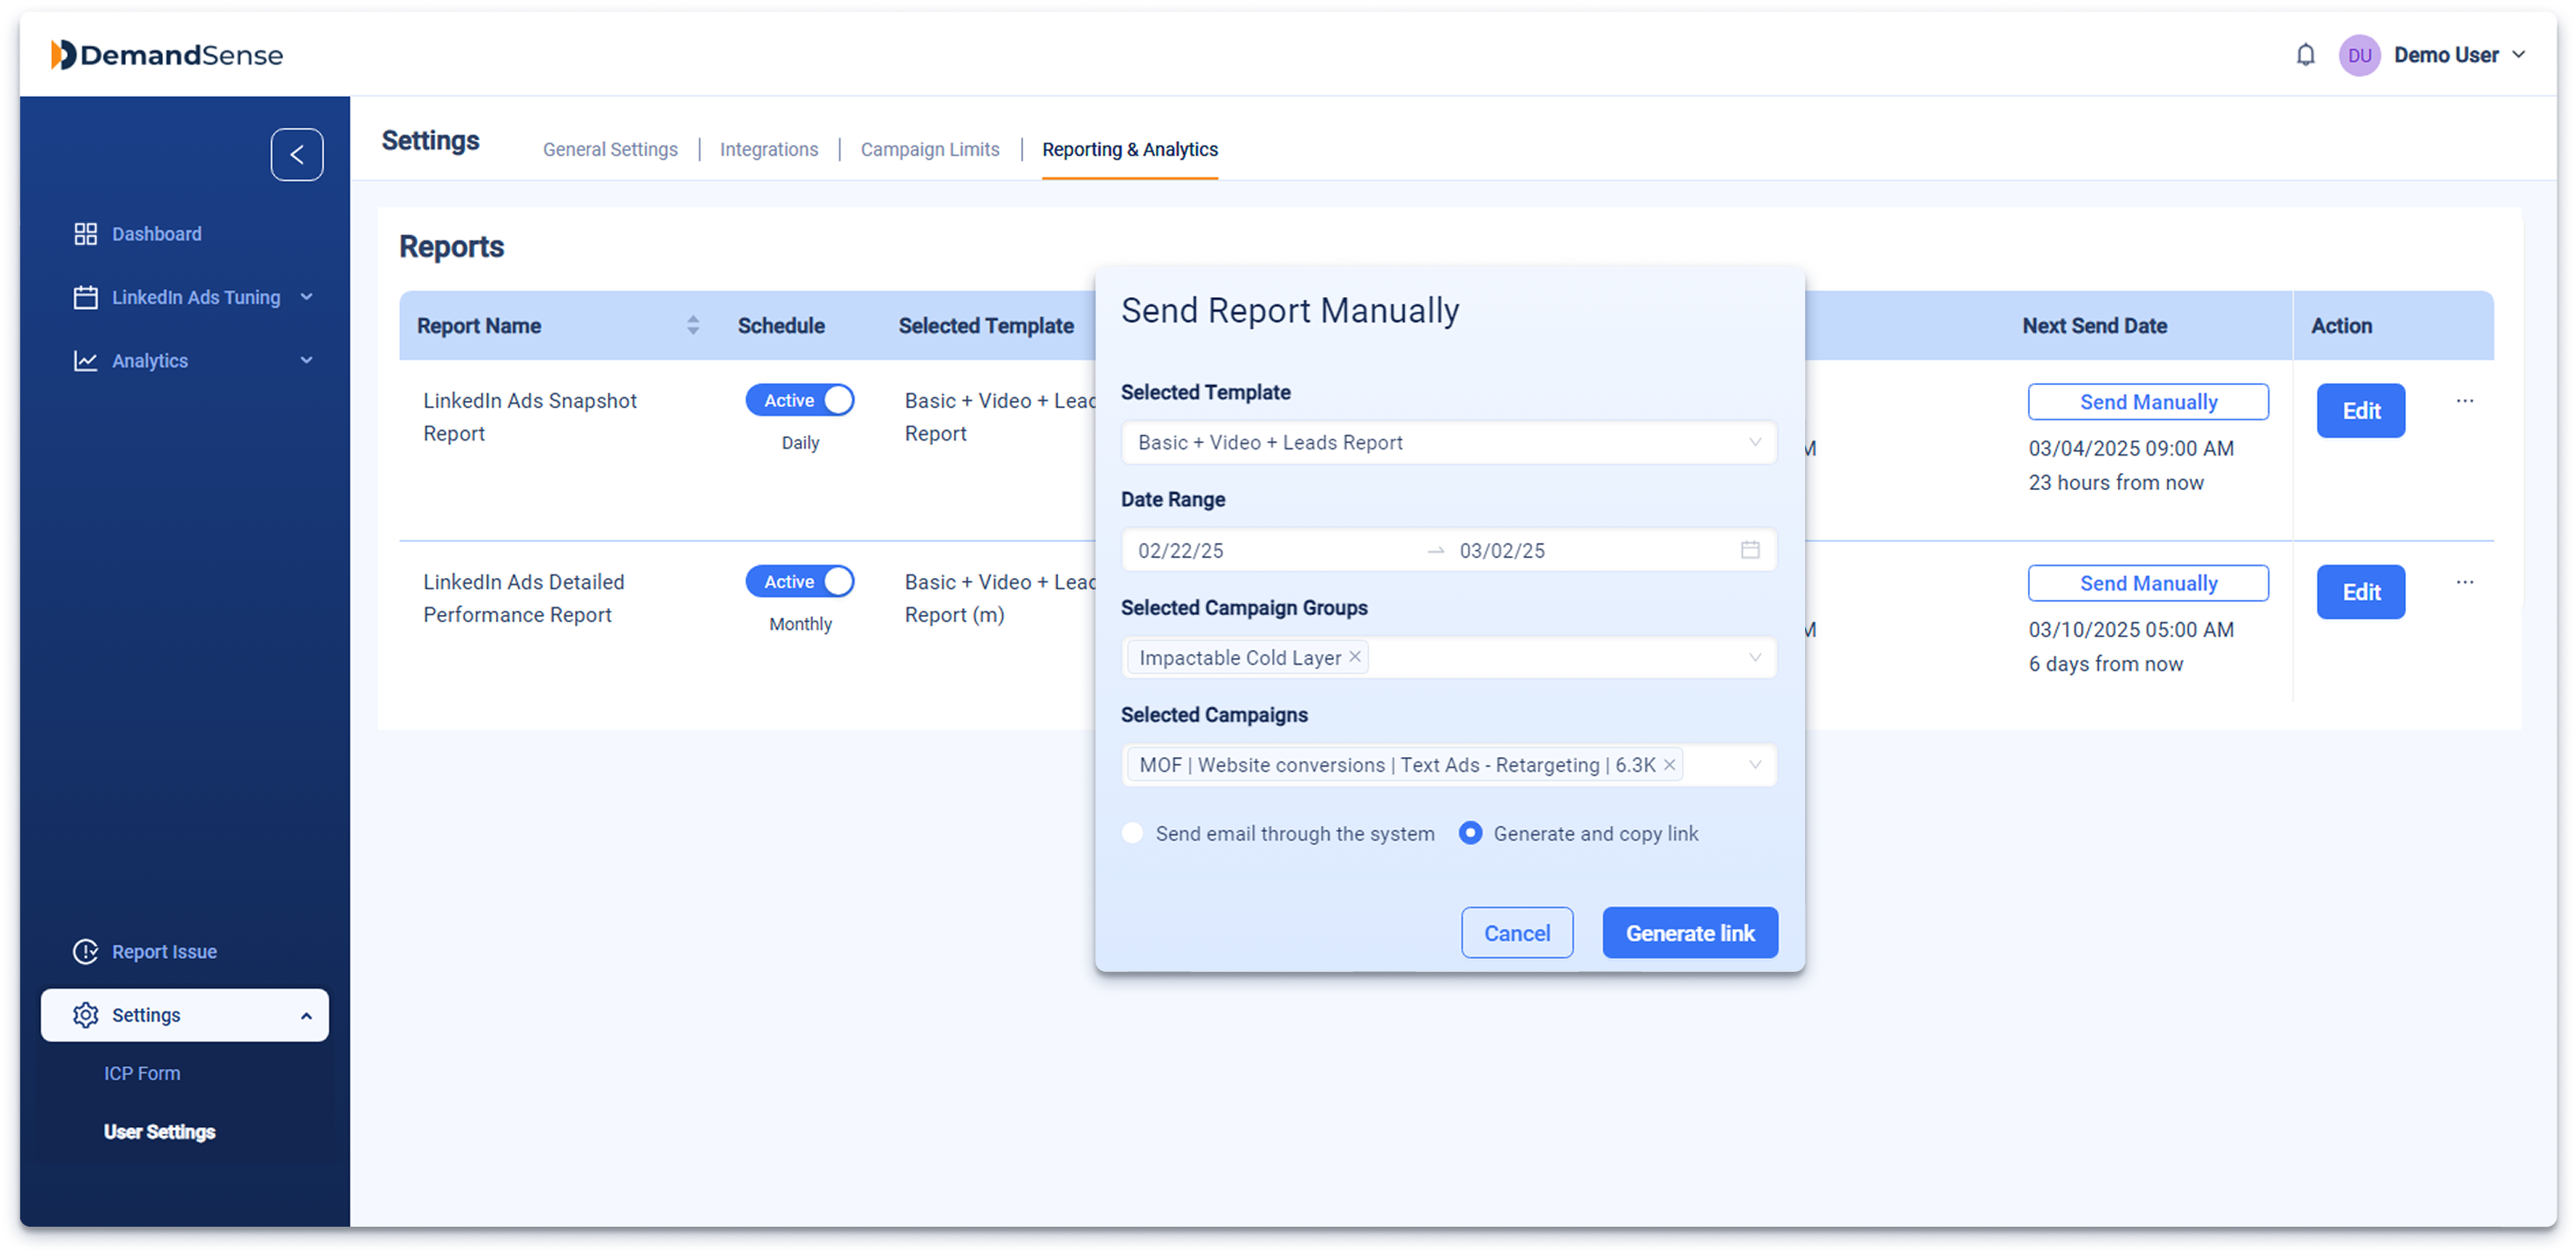
To trigger a manual report, use the Send Manually button in the Next Send Date column. This will open the Send Report Manually popup, where you can customize and send the report outside the regular automated schedule. This is useful for sending reports with a custom date range, such as quarterly reports or when you need a report for the last 45 days, which cannot be done with the standard weekly, bi-weekly, or monthly schedules. Here, you can adjust the following:
- Selected Template: Choose the report template to use.
- Date Range: Define the specific date range for the report. This option offers more flexibility than the scheduled reports, allowing you to generate custom date ranges (e.g., quarterly or client-specific reports).
- Selected Campaign Groups: Choose specific campaign groups to include, focusing on Impactable-managed groups and campaigns.
- Selected Campaigns: Choose individual campaigns within the selected campaign group to narrow down the report.
- Submit Type: Choose how the report will be delivered:
- Generate and Copy Link: Get a link to share the report.
- Send Email Through the System: Requires additional email fields (Subject, Message, Signature, Reply-To, Client Emails, Send CC Emails, and Also Send to Emails). These fields are the same as those found in the Edit Report popup.
When to Use Automated vs. Manual Reports #
Understanding when to use automated versus manual reports can help you streamline your reporting process and ensure you’re getting the most relevant insights for your campaigns.
Automated Reports: For Consistency and High-Level Updates #
Automated reports are ideal for situations where you need regular updates without frequent adjustments. These reports are perfect for consistent, high-level overviews of your campaign performance. You can easily set the frequency (daily, weekly, bi-weekly, or monthly) and define the exact timing (specific day of the week, time of day, or occurrence within the month). This makes it easier to get the data you need without having to manually generate reports each time.
Automated reports work well for clients or teams that need reliable and ongoing updates, such as tracking key metrics or performance trends. Since they require minimal intervention, they help you stay informed without the hassle of creating new reports regularly.
Manual Reports: For In-Depth Analysis and Customization #
Manual reports give you more control and flexibility, allowing you to dive deeper into your campaign data. These reports are best suited for specific, custom insights—like analyzing individual campaigns, ad types, or particular date ranges. If you need to focus on particular metrics or specific data points, manual reports provide the customization you need.
With manual reports, you can choose delivery methods—whether you prefer the report to be emailed directly or sent as a link for easy sharing. Plus, you can send reports to multiple recipients, ensuring everyone who needs the information receives it.
Using Both Automated and Manual Reports Together #
By combining both automated and manual reports, you can optimize your reporting workflow. Use automated reports for ongoing, high-level updates, while using manual reports when you need to focus on specific insights or custom data. This balanced approach ensures you always have access to relevant information for decision-making, whether it’s for routine check-ins or more detailed analysis.
For any assistance with setting up or customizing your reports, feel free to explore additional resources or reach out for support.