
Competitor Monitoring gives you a clear, always-fresh overview of exactly what your competitors are running on LinkedIn—both today and going back up to 1 year.
You’ll be able to see:
- All active and historical ads in a clean grid (Ad Library)
- Long-running Winners (creatives still being shown after weeks/months)
- Modified versions when a competitor changes copy, image, CTA, or format
- Daily/weekly launch patterns and lifespan breakdowns
- Rich AI-powered insights: hooks, offers, angles, formats, funnel stage, and ready-to-test A/B ideas
- Non-US market coverage stats (especially valuable for EU/EMEA creatives with extra transparency)
Important: In the current version, Competitor Monitoring works only with LinkedIn Ads. Support for Meta (Facebook/Instagram) and Google Ads is planned for a future release.
Why teams use it #
- Discover new offers, hooks, and messaging before your prospects see them
- Identify proven Winner creatives (the ones LinkedIn continues to push)
- Get location-specific insights for EU-based campaigns
- Turn real competitor activity into concrete A/B test ideas in minutes
How to Start #
- In the left sidebar, go to LinkedIn Ads Optimization → Competitor Monitoring.
- On the Home view, click Add Folder (examples: “Direct Competitors”, “Category Leaders”, “Inspiration Brands”).
- Click Add Brand and enter a domain (best accuracy) or company name.
- We show a shortlist with logo, follower count, and verified badge → select the correct LinkedIn page.
Once added, our system automatically begins a smart historical backfill (up to 12 months) using efficient time windows and image/video “last-modified” dates. Data usually starts appearing within a few hours.
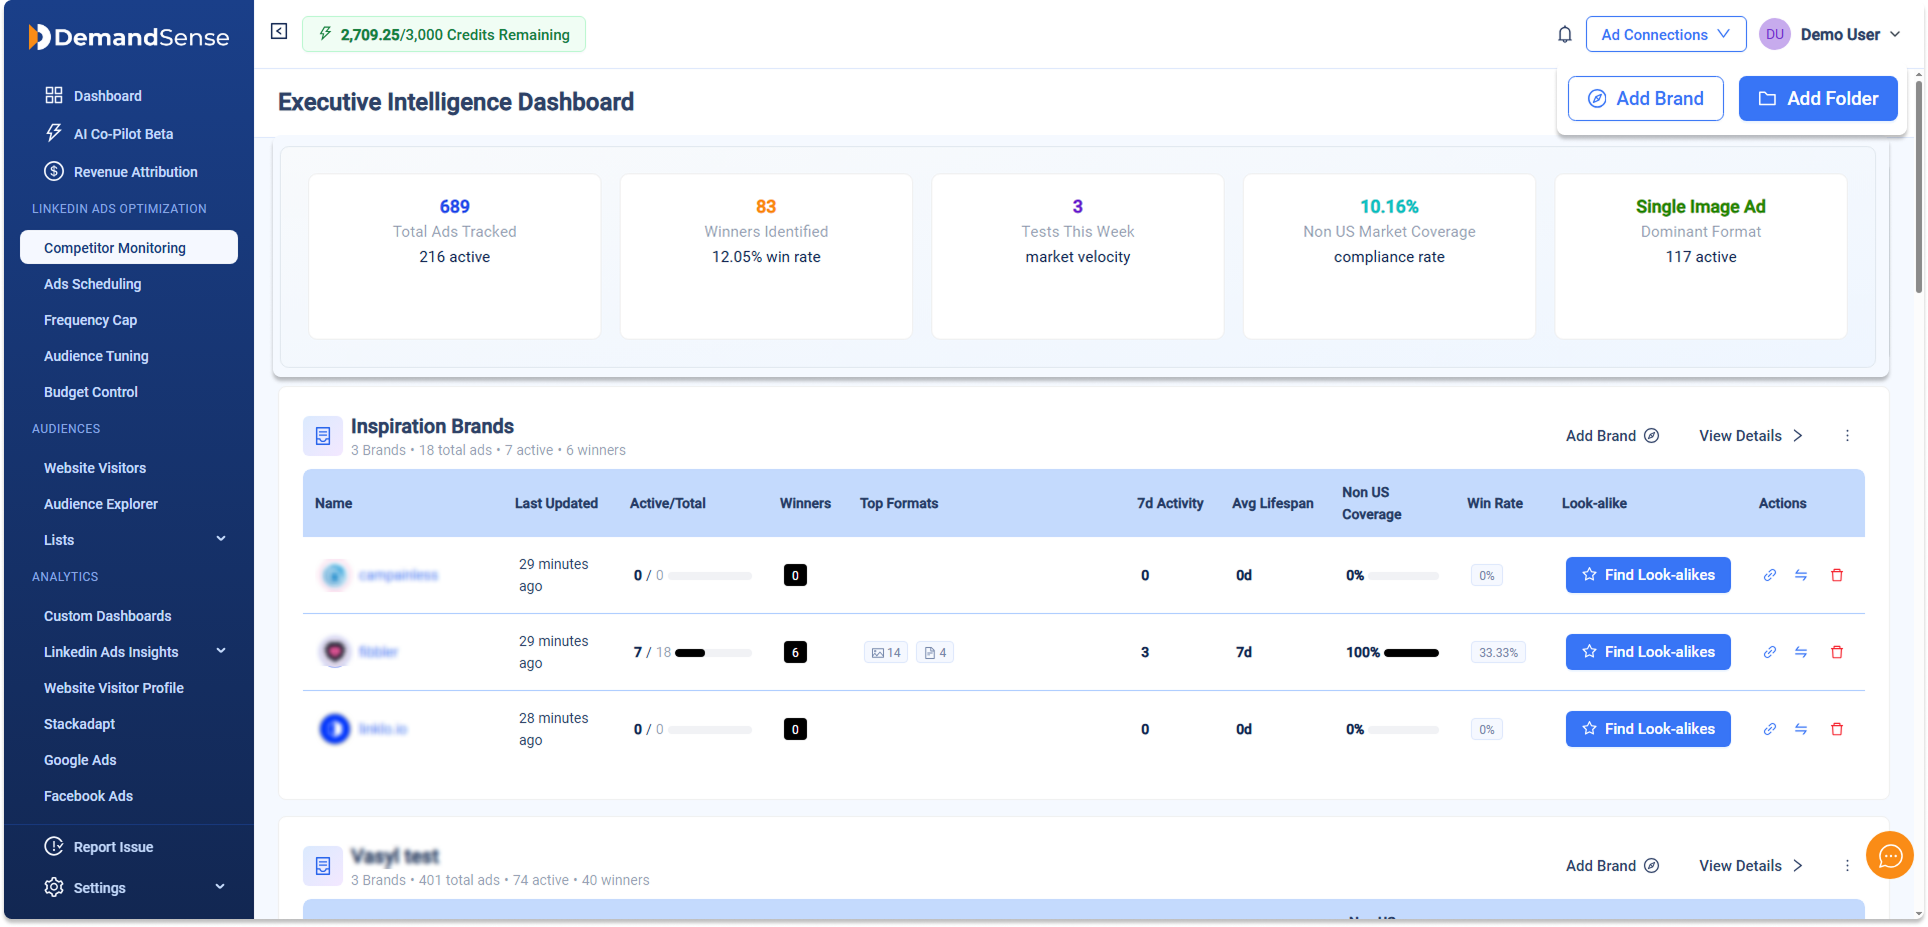
Main Dashboard Overview #
After adding folders and brands, you’ll see:
- Overall stats at the top: Total Ads Tracked, Winners Identified, Tests This Week, Non-US Coverage %, Dominant Format
- List of your folders with summary cards for each brand:
- Active / Total ads
- Winners count
- 7-day activity
- Average lifespan
- Win rate
- Look-alike finder button
- Quick actions (View Details, Add Brand, etc.)
Click any brand name to open its dedicated view with four tabs.
| Tab | What you see | Best for |
|---|---|---|
| Ad Library | Masonry/grid of all creatives (active + historical). Filters: date range, sort (Newest, Oldest, Longest Run), format (Single Image, Video, Carousel, Text, etc.). Badges: Running, Winner Identified, Non-US, Promoted. | Browsing every creative, quick inspiration, filtering by format/date |
| Creative Tests | Daily-grouped view of launches with Winner badges. Shows running ads, the number running per day, and the format breakdown per day. Hover/expand to see exact creatives. | Spotting launch patterns, identifying winners, daily monitoring |
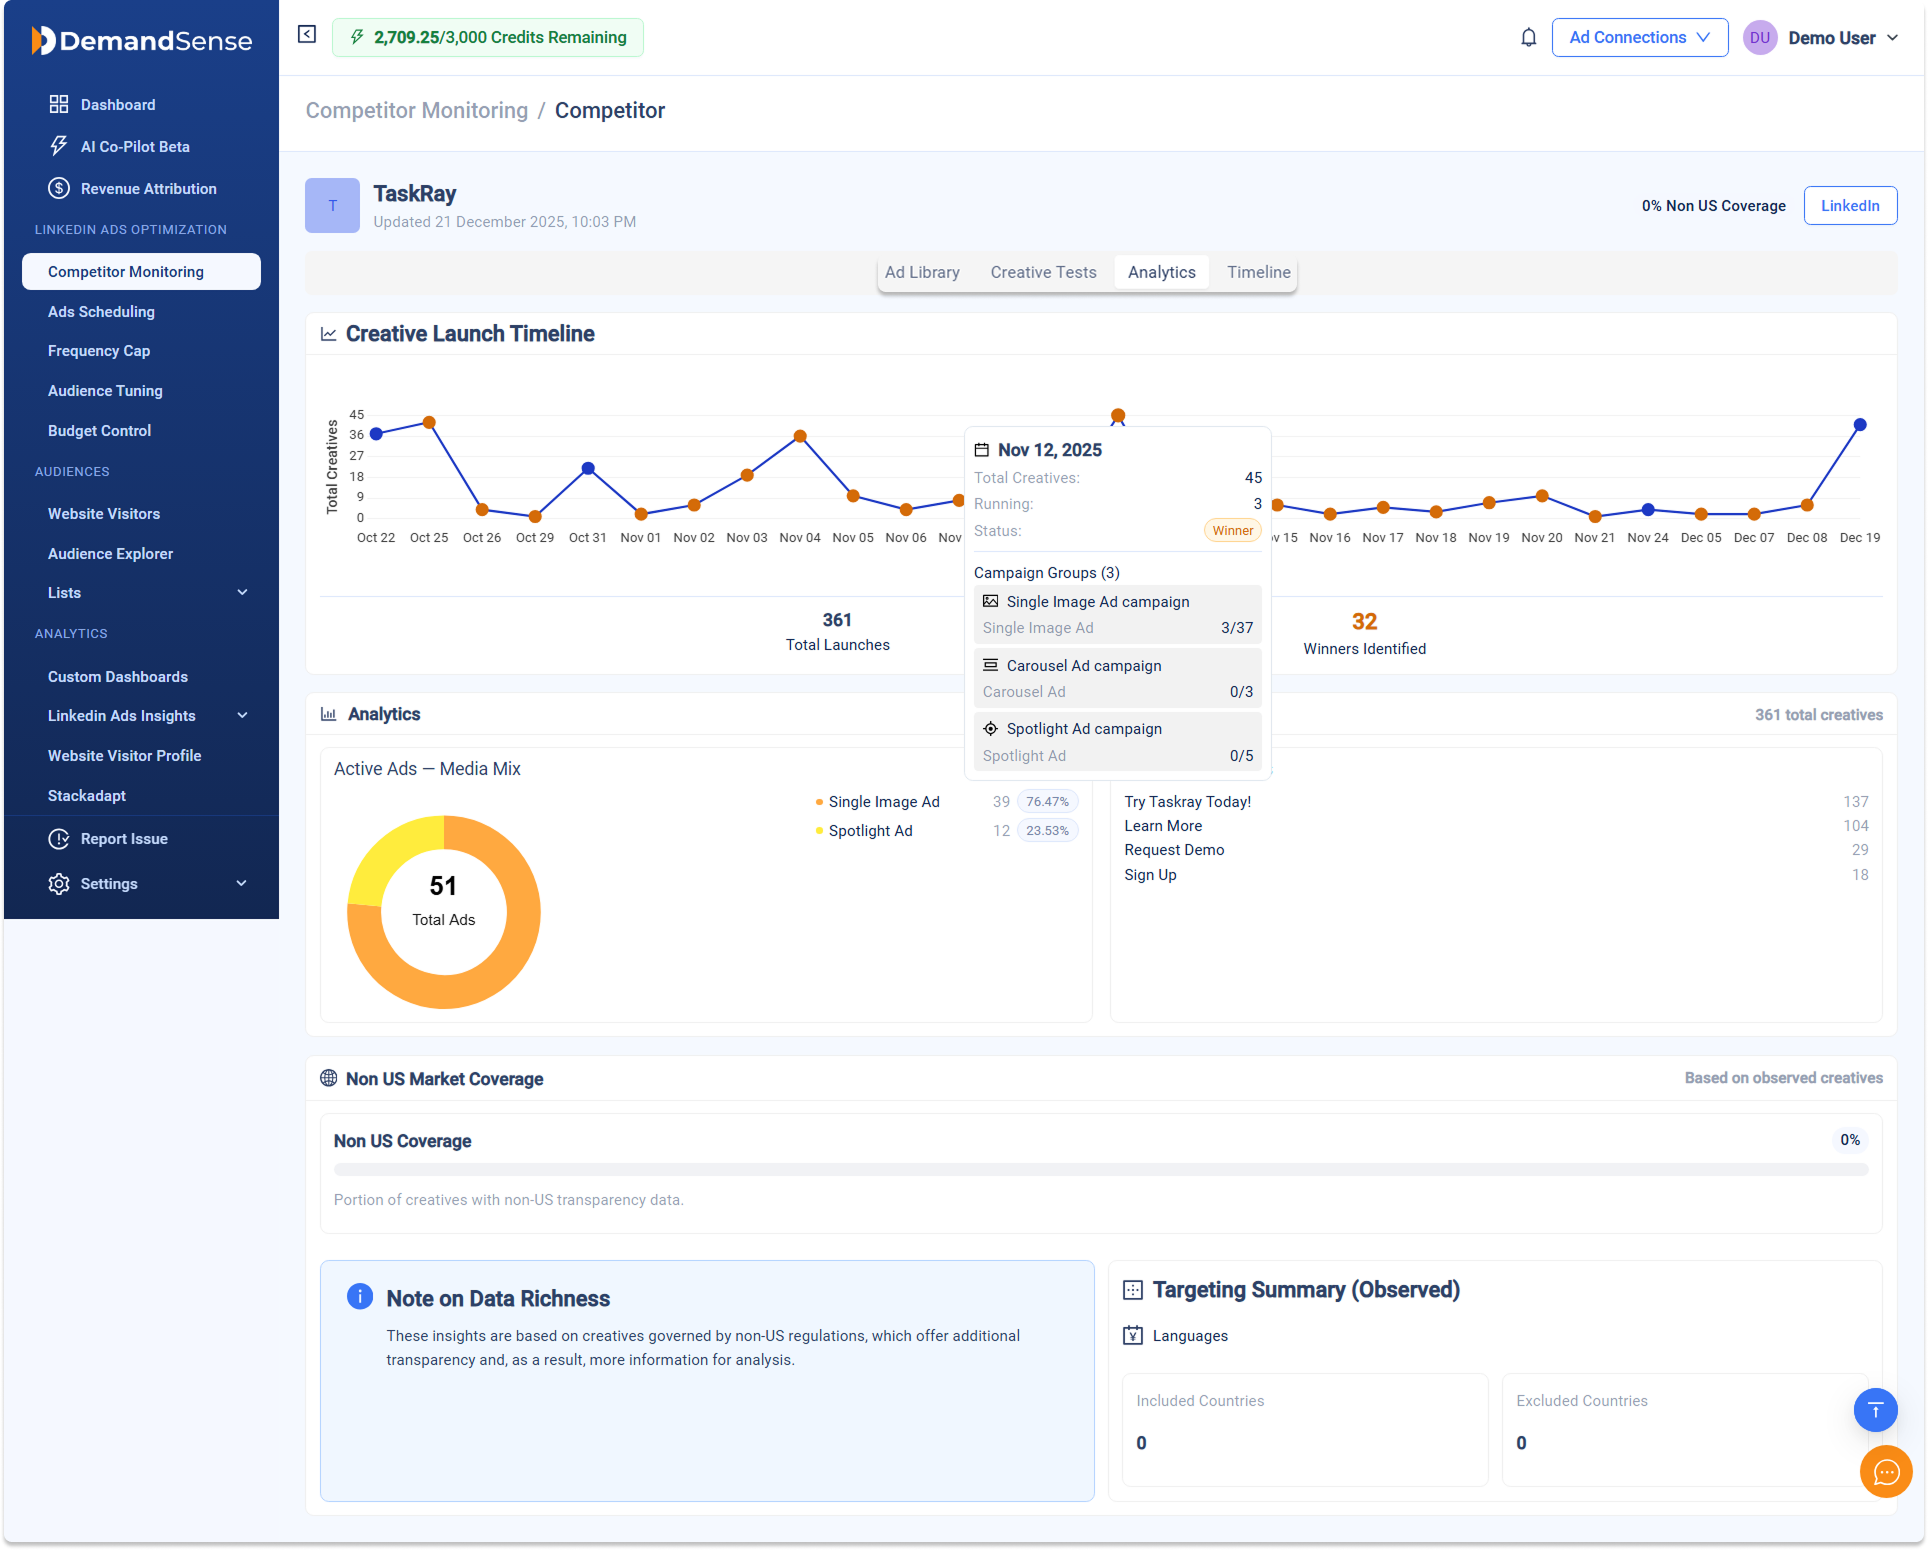
| Analytics | Creative launch timeline chart (total launches over time), media mix pie (format breakdown of active ads), Top Call-to-action count, Non-US Market Coverage bar + country share breakdown (EMEA, Europe, US, etc.), and Targeting Summary (languages, included/excluded countries). Note on data richness for non-US creatives. | Understanding format trends, geographic targeting, high-level performance signals |
| Timeline | Calendar/table view of creatives by day/week/month/year (selectable scale). Each cell shows creatives running that period + duration bars (color-coded). Click any cell/creative to open details. | Seeing exact run durations, overlaps, long-running patterns |
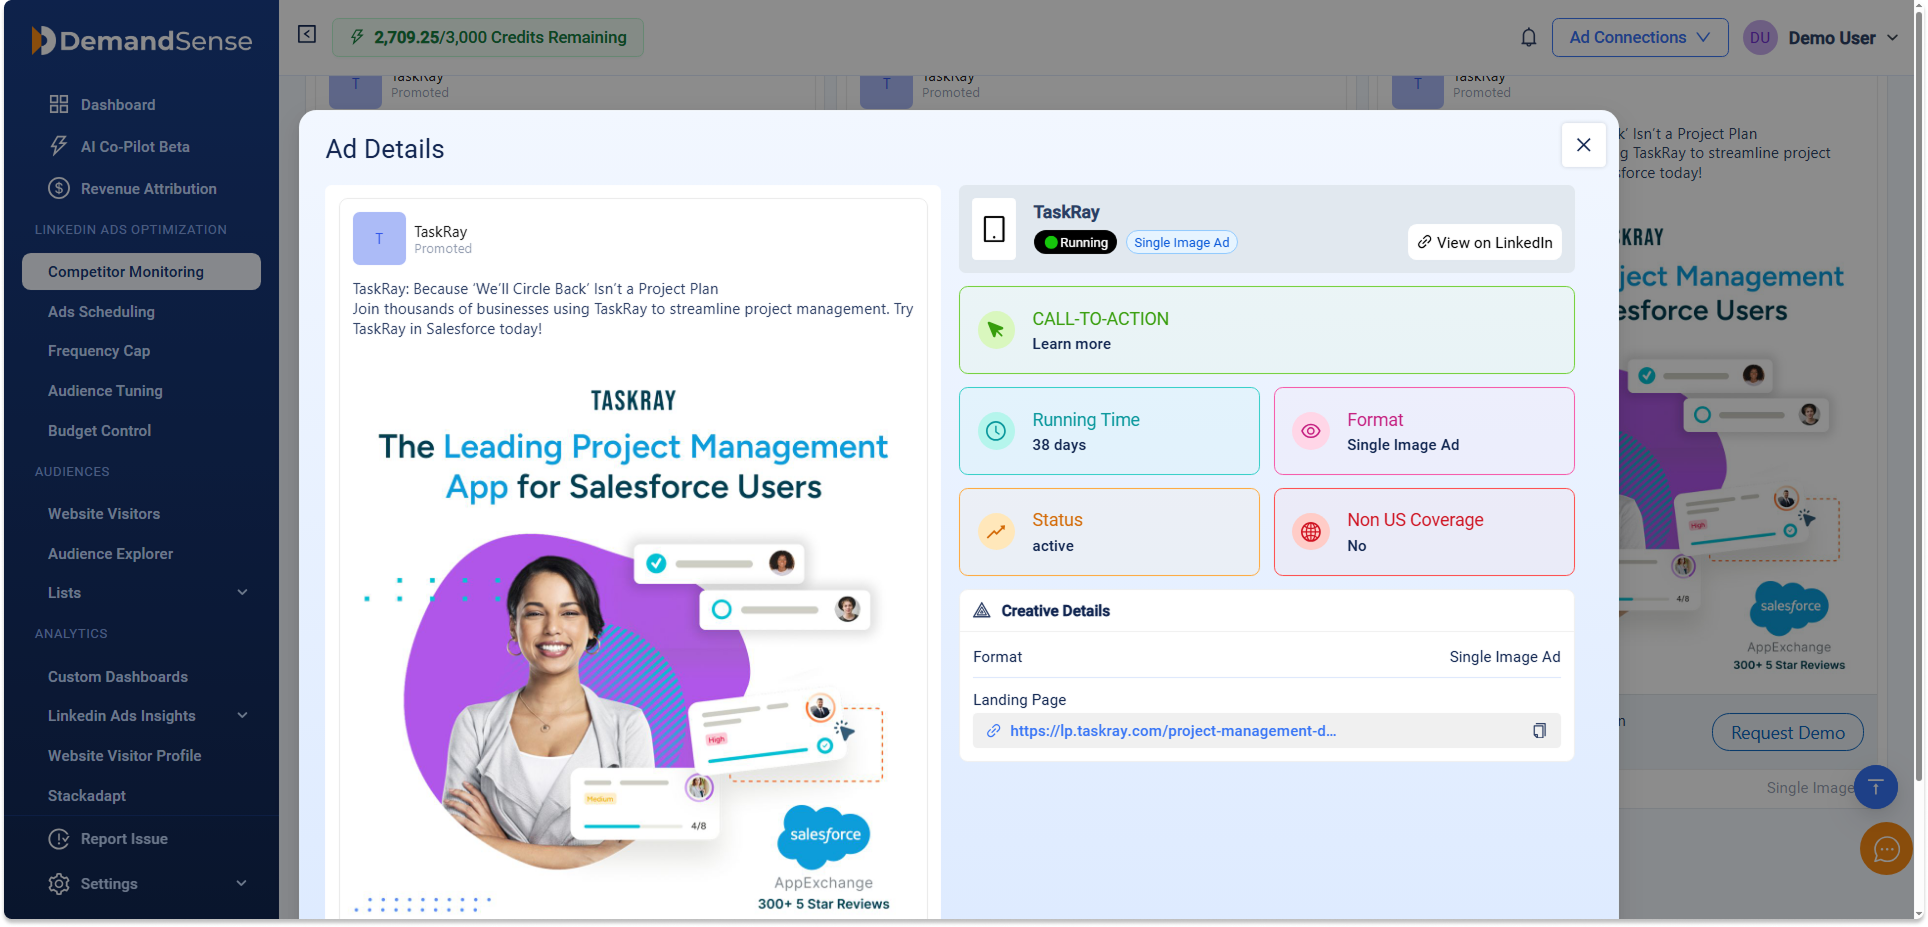
Ad Details Pop-up #
Clicking a creative in any tab opens a detailed overlay:
- Preview of the ad (image/video/text) + full copy
- Badges: Running / Winner Identified / Format / Non-US Coverage
- Key stats: Running Time (e.g., 25 days), Status (active), Language, Landing Page link
- Targeting: Included countries (e.g. United States, EMEA), Excluded countries
- Performance signals (when available): Influenced deals, won deals, pipeline value, ROI multipliers
- “View on LinkedIn” button → direct link to original ad library page
Understanding “Winner Identified” badge #
A Winner is a creative that LinkedIn keeps delivering to audiences over an extended period (weeks or months). We detect winners by monitoring daily whether each ad remains active.
These are usually the highest-signal creatives—they’ve already proven effective enough to survive the platform’s delivery algorithm.
Non-US vs US Coverage #
Non-US creatives (especially EU/EMEA-based) provide richer public data via transparency rules:
- Approximate impressions, spend ranges, influenced metrics
- Country breakdowns (included/excluded)
- Language targeting
US-only creatives show less metadata, but we still track run duration, status, and format via daily monitoring and asset headers.
Pro Tips #
- Begin with 2–3 closest competitors to keep insights focused and actionable.
- Use folders to group brands logically (competitors vs. aspirational brands).
- Click “Find Look-alikes” on any brand card to discover similar companies worth tracking.