
Ask for next quarter’s revenue forecast and you’ll usually get the pipeline report: open deals, stage probabilities, a total at the bottom. It’s a fair read on the deals sales already knows about. The part of the number that has to come from accounts nobody has talked to yet is usually a guess.
Those accounts leave a trail, though. They click your LinkedIn ads and visit your site weeks before anyone creates an opportunity. This guide covers how to build a B2B revenue forecast step by step, and how to use those signals for the part the pipeline can’t show yet.
Summary: How to Build a B2B Revenue Forecast With LinkedIn and Account Signals
- A B2B revenue forecast is an estimate of how much revenue your company will book in a set period, built from the pipeline you have and the pipeline you expect to create.
- Building one takes three steps: gather your data, pick a forecasting method, then build the model and adjust it as results come in.
- Most B2B forecasts start with open opportunities, because that is where CRM data begins. That leaves out the revenue in your plan that isn’t in the pipeline yet.
- LinkedIn engagement, site visits and CRM activity, tracked per account, show which ICP accounts are moving toward a buying conversation.
- Check the forecast against closed revenue every month, and adjust the assumptions where the two differ.
What Is B2B Revenue Forecasting?
B2B revenue forecasting is the process of estimating the revenue a business will book over a set period, such as a month, a quarter or a year. The estimate is built from historical data, the current sales pipeline and the drivers behind revenue growth.
B2B adds complications most other forecasting doesn’t face. Sales cycles run for months. A few large deals can swing a whole quarter. Several people take part in each buying decision, which makes timing hard to call. And revenue tends to show up long after the marketing that started the conversation, so the link between the two is easy to lose.
Revenue Forecasting vs. Sales Forecasting
A sales forecast and a revenue forecast overlap, but they don’t cover the same ground:
| What it covers | Built from | What it leaves out | |
|---|---|---|---|
| Sales forecast | Deals sales is working on now | Open opportunities in the CRM | Renewals, expansion and deals not created yet |
| Revenue forecast | All revenue: new business, renewals, expansion, and new business that isn’t in the pipeline yet | Historical revenue data, contracted recurring revenue, pipeline and growth drivers | Nothing by design, though the pre-pipeline part is the hardest to estimate |
That last column is where this article is heading. The revenue that isn’t pipeline yet is the part marketing and account signals help you estimate.
Core Components of a B2B Revenue Forecast
A reliable revenue forecast model has the same seven parts, whatever spreadsheet or tool holds it:
- Revenue streams: new business, renewals and expansion, forecast separately because they behave differently.
- Forecast horizon and cadence: the period you’re projecting (month, quarter or year) and how often you update it.
- Historical baseline: past revenue by stream and period, so the model has something to compare against.
- Revenue drivers: pipeline volume, win rate, deal size, sales cycle length and churn.
- Assumptions, written down: every input that is a judgment call, recorded so it can be questioned later.
- Scenarios: a base case plus a better and a worse case, so the range is visible.
- Forecast vs. actual tracking: a monthly comparison of what you expected with what closed.
What Data Do You Need for a B2B Revenue Forecast?
A B2B revenue forecast needs data from three places:
- Historical revenue data: bookings by month and revenue stream, win rates by stage, average deal size, sales cycle length, churn and expansion.
- Pipeline data: open opportunities with their stage, amount and expected close date.
- Marketing and account signals: ICP accounts engaging with your LinkedIn ads, identified site visits, meetings booked and new opportunities created by source.
The first two are standard. The third is the one most B2B teams leave out, because it sits in Campaign Manager and web analytics rather than in the CRM.
Common B2B Revenue Forecasting Methods
Six methods come up most often. Most teams combine two or three, depending on the forecast horizon and how much historical data they have.
- Bottom-up forecasting: builds the forecast from deals, reps or accounts and adds them into a total. Use it when your CRM data is clean and the sales team knows its pipeline well enough to commit to numbers.
- Top-down forecasting: starts with market size and multiplies it by the share you expect to win. Use it for new markets, a new product or service, and long-range planning, where there’s little history to build up from.
- Straight-line forecasting: carries last period’s growth rate forward. Use it for stable recurring revenue with a steady trend. A moving average smooths out noisy months, and time series analysis (exponential smoothing, for example) is the next step up.
- Weighted pipeline forecasting: multiplies each open deal’s value by its stage probability. Use it for the current quarter. Example: a $40,000 deal at 60%, a $25,000 deal at 30% and a $15,000 deal at 80% give $24,000 + $7,500 + $12,000 = $43,500 of expected revenue.
- Driver-based forecasting: models revenue from its drivers, such as pipeline created × win rate × deal size. Use it when you want to see what moves the number. This is the method that lets marketing inputs in, because account engagement can feed the “pipeline created” driver.
- Scenario and predictive forecasting: scenarios set out a best, base and worst case. Predictive models apply regression analysis or machine learning to historical data. Use them when you have enough history and want a range rather than one number.
How to Build a B2B Revenue Forecast Step by Step
These five steps take you from raw CRM data to a forecast you can check every month.
1. Gather Historical Data and Define the Forecast Horizon
Start with what the CRM already holds: bookings, win rates, deal sizes and cycle lengths. Choose the horizon, a quarter or a year, and the update cadence that goes with it.
Clean the data before you use it, because a deal with a missing close date or amount distorts everything built on top of it:
- fix or remove deals with no close date
- fix or remove deals with no amount
- check that closed-won and closed-lost stages are used consistently
2. Identify Revenue Streams and Key Revenue Drivers
New business, renewals and expansion behave differently, so forecast each on its own. New business depends on four drivers: pipeline created, conversion by stage, deal size and cycle length. Market conditions and other external factors can shift any of them, so write down what you expect them to do.
3. Choose a Forecasting Method and Build the Baseline Forecast
Match the method to the data you have:
- Weighted pipeline for the current quarter
- Driver-based for next quarter and beyond
- Straight-line as a sanity check on both
The baseline is what happens if nothing changes. Everything you add in the next step is measured against it.
4. Add LinkedIn Ads, Marketing, and Account Signals to the Forecast
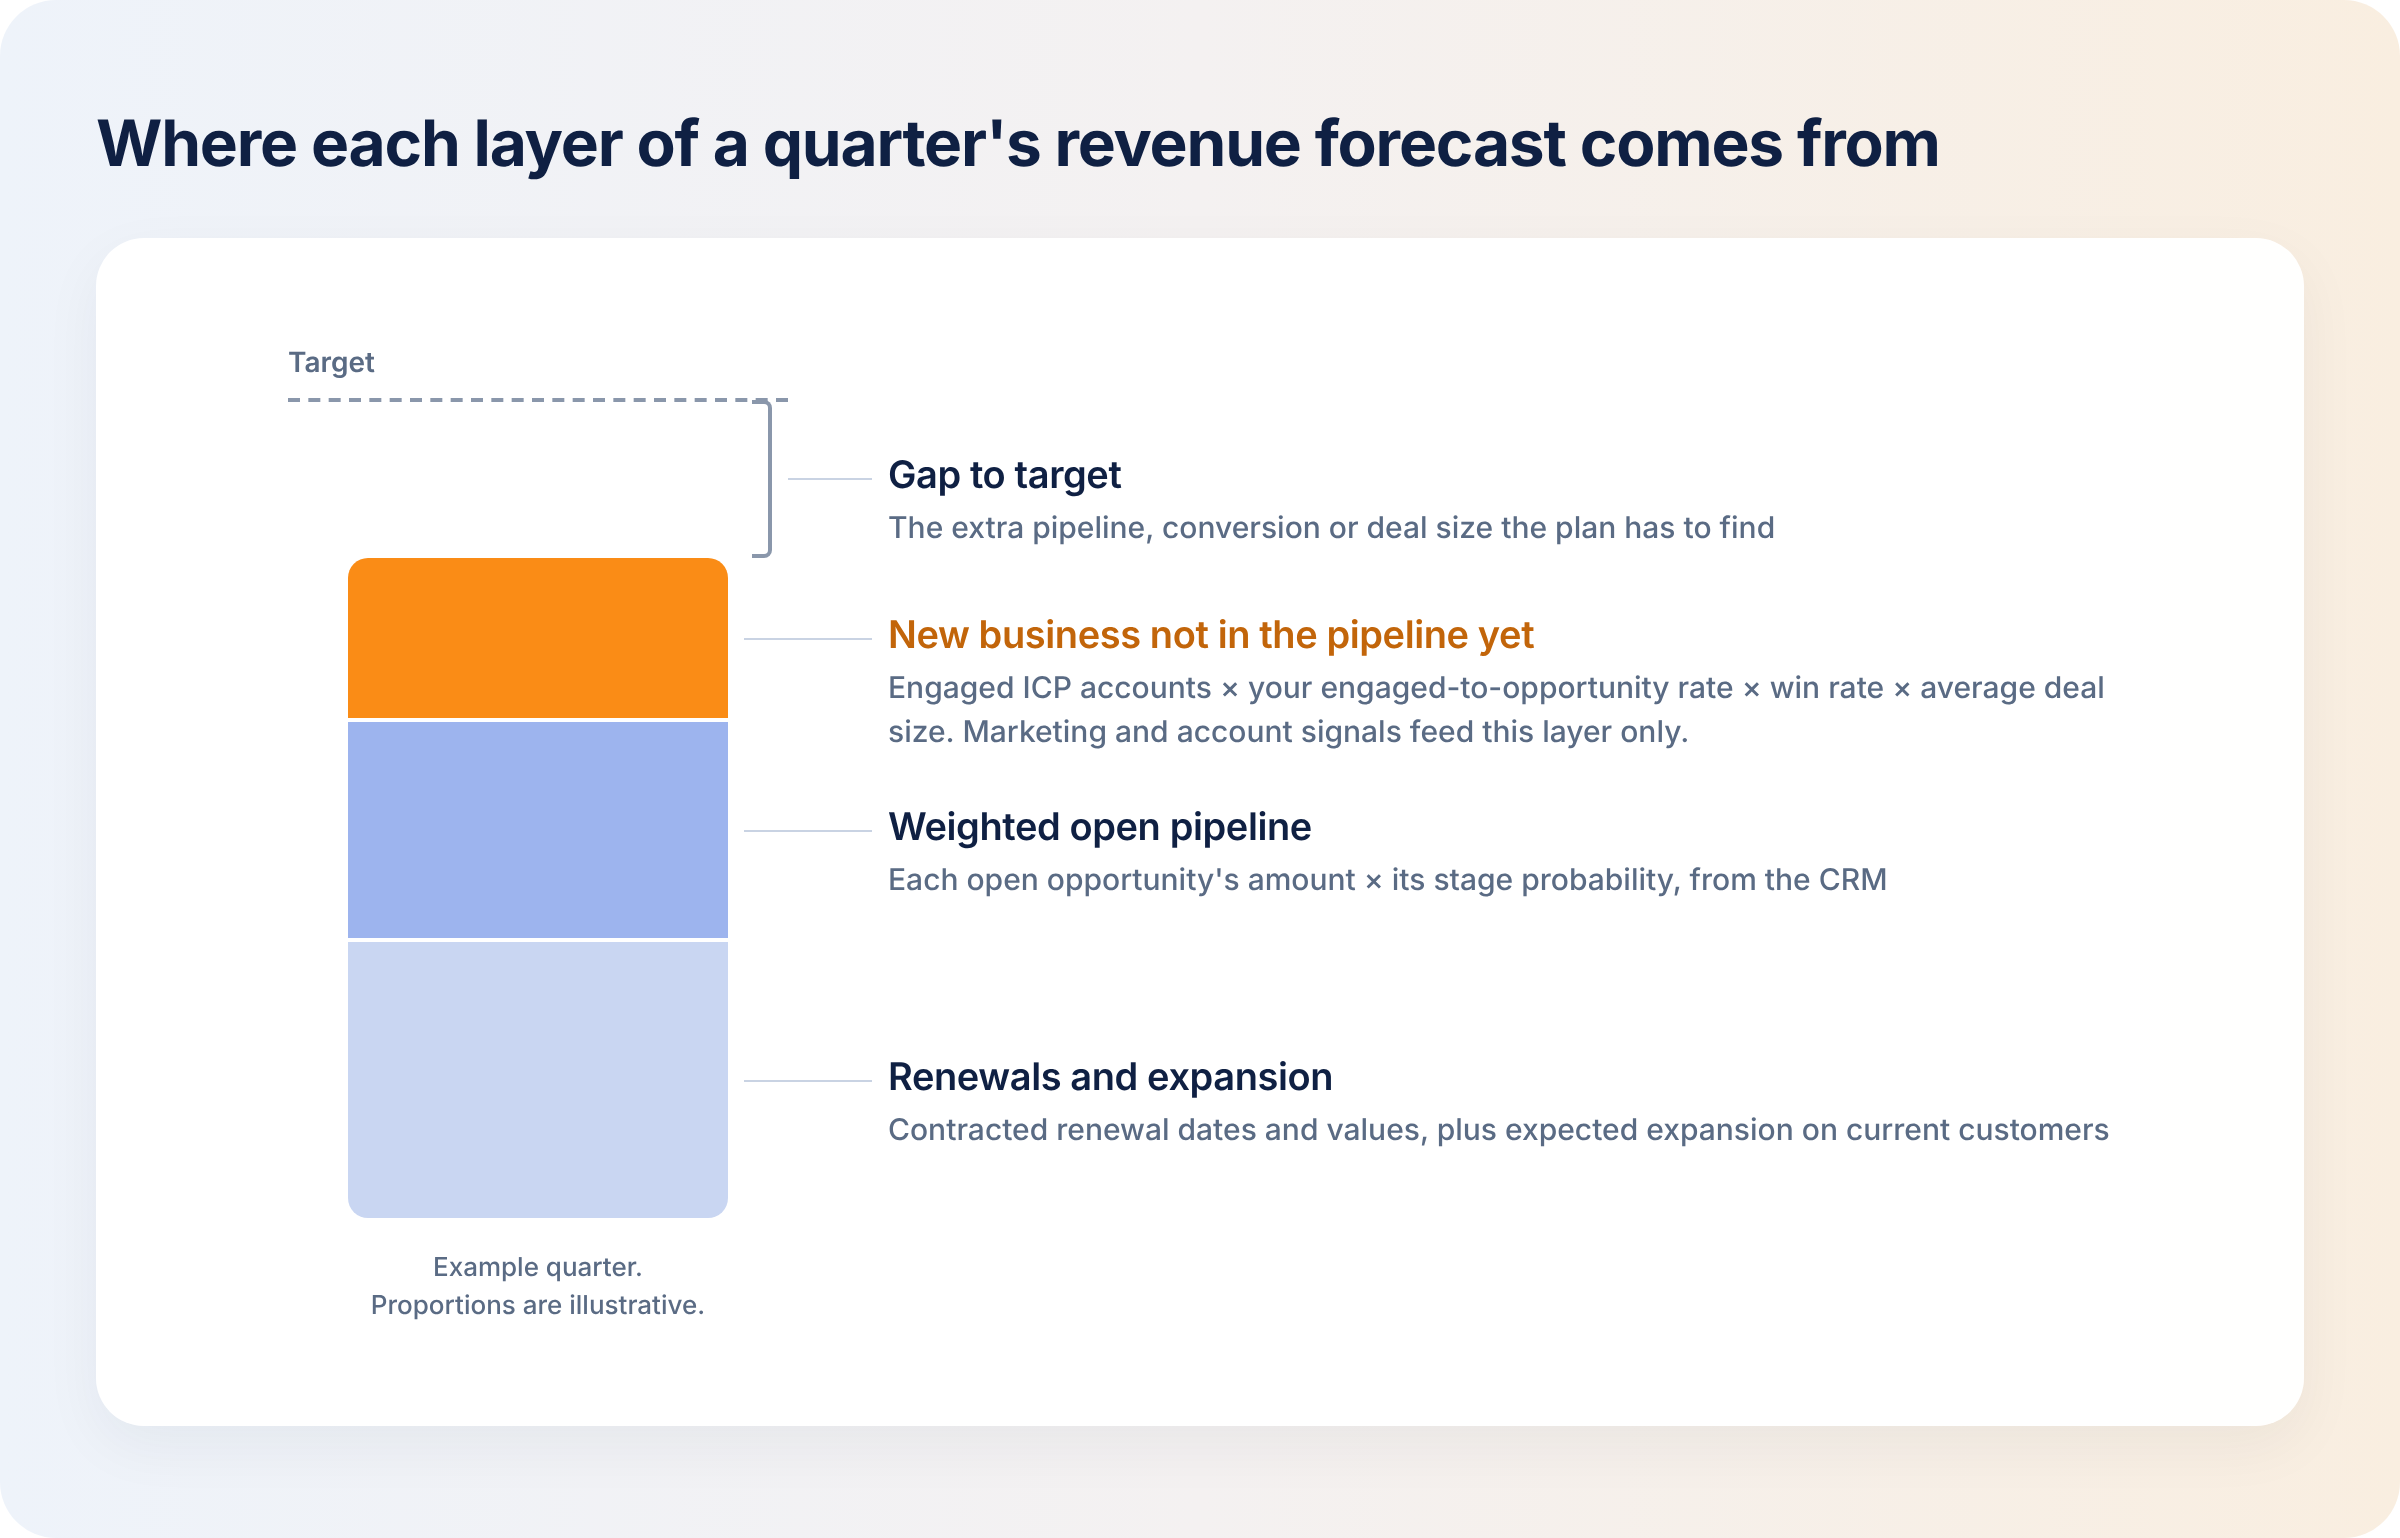
Most of next quarter’s pipeline doesn’t exist in the CRM yet. Account signals give you a way to estimate it:
- Write down what an engaged ICP account is: which accounts, which actions and over what window.
- Count engaged accounts every month and note whether the number is rising or falling.
- Check your own history for how many engaged accounts turned into opportunities, and how long it took.
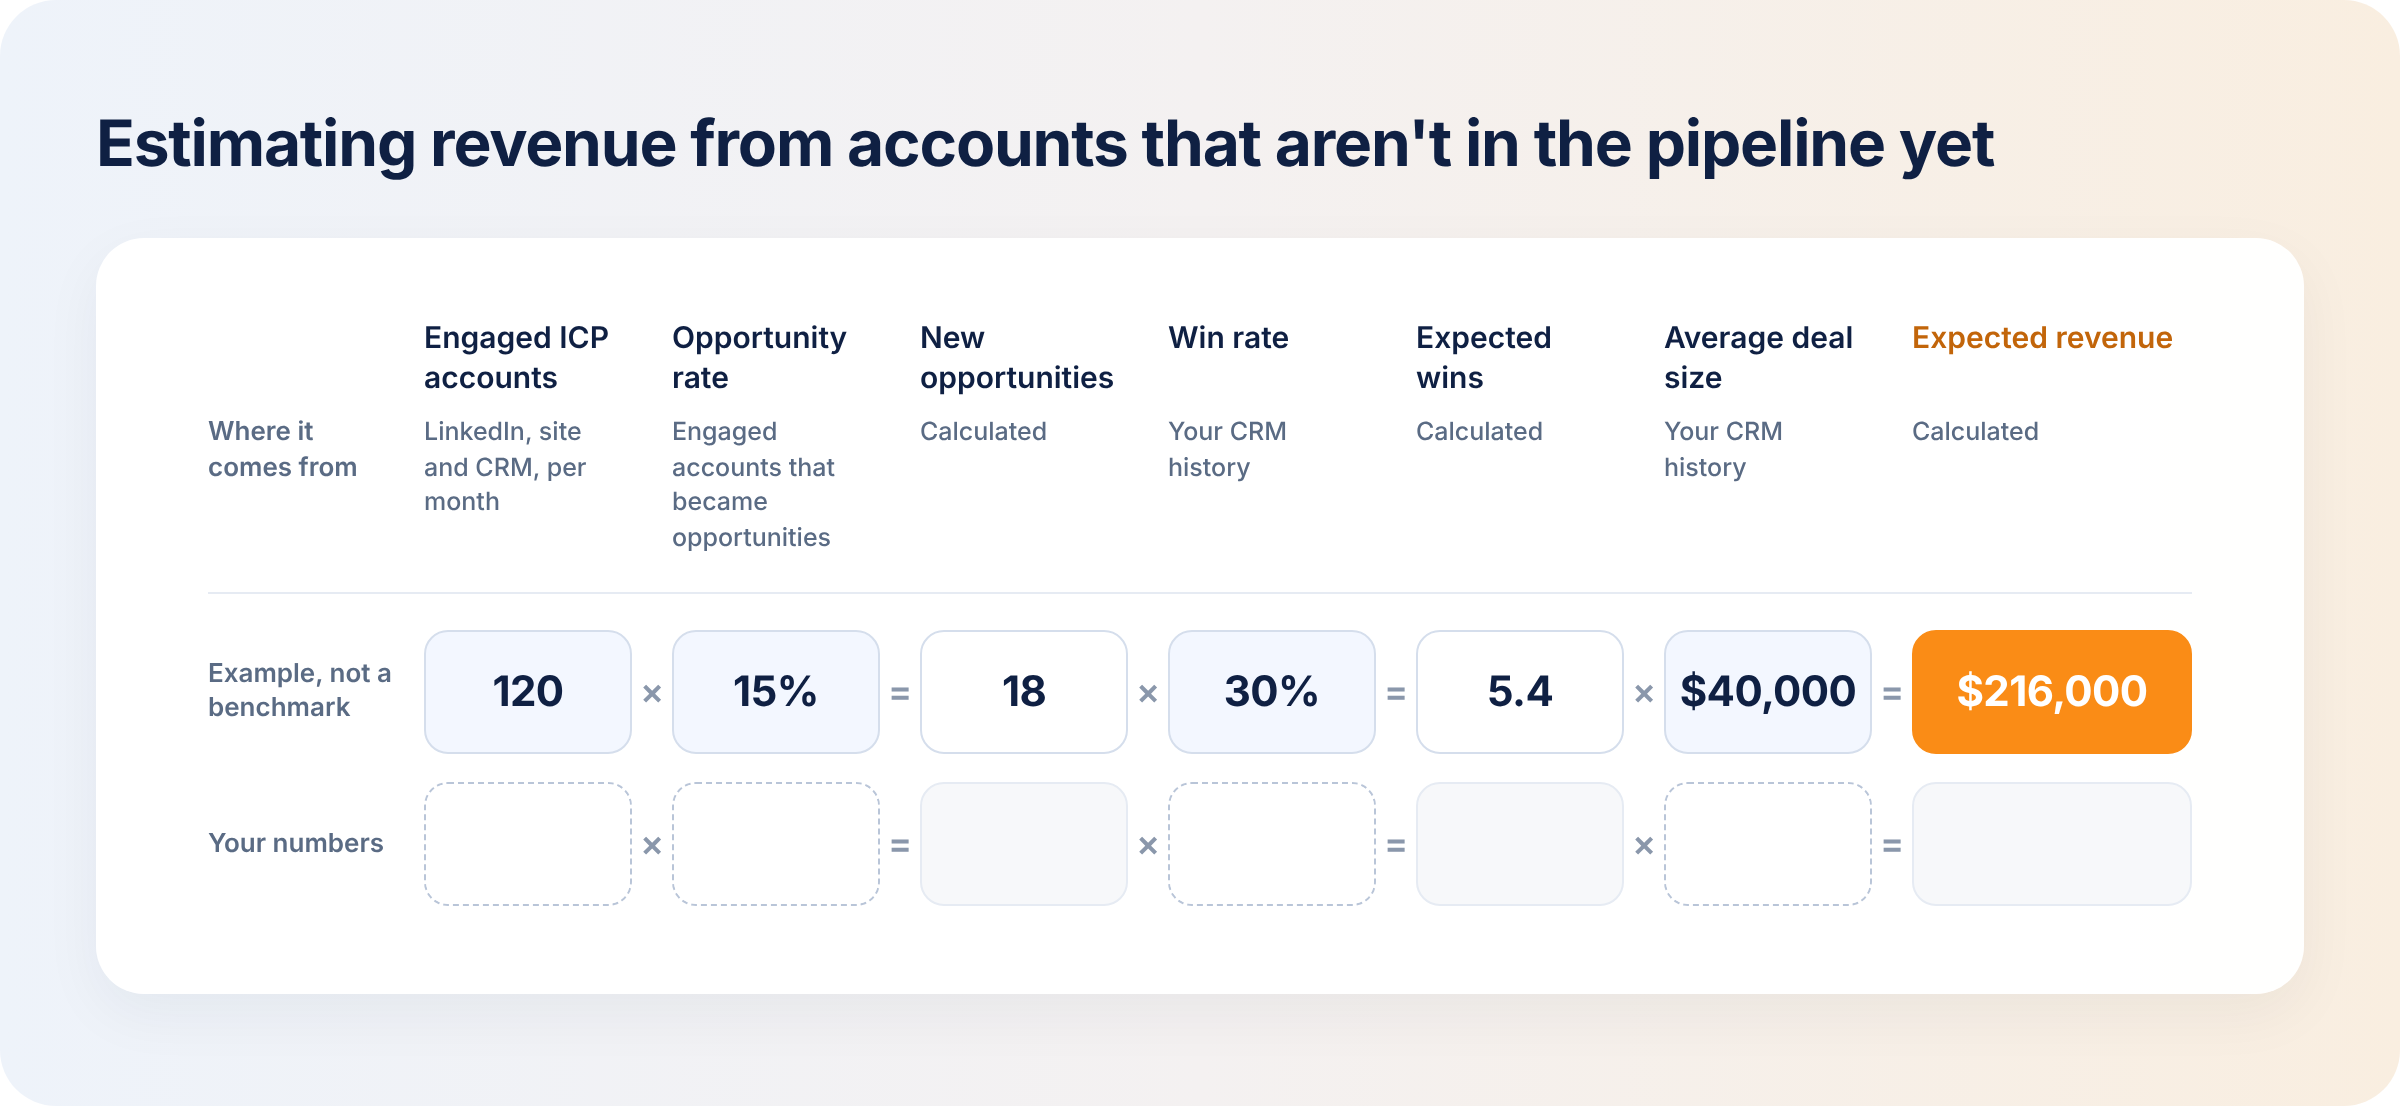
- Apply that rate as a driver for the pipeline that hasn’t been created yet. Example only: 120 engaged accounts × 15% = 18 new opportunities. 18 × 30% win rate = 5.4 expected wins, and 5.4 × $40,000 average deal = $216,000 of expected revenue.
- Between forecasts, watch the leading indicators: whether engaged accounts are rising or falling, and which engaged accounts have no CRM record.
Keep this layer to the pre-pipeline part of the forecast. It never adds to deals already in the CRM.
DemandSense reads LinkedIn engagement, site visits and CRM activity side by side, so the engaged accounts and the ones missing from the CRM don’t have to be stitched together from three reports. Teams that want to model these signals more formally use predictive attribution, and the impression side starts with how you connect LinkedIn impressions to pipeline.
5. Build Scenarios, Compare Actual Revenue, and Refine the Model
Build a best, base and worst case by changing the drivers. A lower win rate gives you the worst case, and more pipeline created gives you the best. After each month:
- compare forecast with actual revenue for each stream
- find the driver that was wrong
- change the assumption behind it
Record each change and the reason for it in a forecast log, so next quarter you can see which assumptions kept moving.
Best Practices for More Reliable B2B Revenue Forecasting
- Keep one source of truth for stage definitions. If “proposal sent” means one thing to a rep and another to finance, stage probabilities and the pipeline numbers built on them stop being comparable.
- Separate the forecast from the target. Mixing what you expect with what you want hides the gap you most need to see.
- Forecast each revenue stream on its own. New business, renewals and expansion have different drivers, and a combined number hides which one is slipping.
- Write down your assumptions so anyone can challenge them. A recorded win rate or deal size can be questioned and corrected. One that lives in someone’s head just gets repeated.
- Hold a monthly forecast-vs-actual review. It’s how you find out which driver was wrong.
- Get marketing and sales to agree what counts as pipeline. The two teams often count different things, which breaks the link between marketing activity and revenue. Settling the definition is most of what LinkedIn pipeline attribution is about.
The revenue forecasting mistakes to avoid are the same list turned around, starting with vague stages and a target passed off as a forecast.
How AI Can Improve B2B Revenue Forecasting
What AI does well:
- finding patterns across historical deals
- flagging deals that look at risk
- summarizing what changed in the pipeline since the last review
- answering questions about revenue data in plain language
Clari and Gong both build AI into their forecasting products, mainly for risk flags and deal-outcome prediction.
The limit. A model trained on messy CRM data gives confident answers that are wrong: missing close dates, inconsistent stages and duplicate deals all feed straight into the output. Most B2B teams also have too few closed deals for a model to learn much from, so clean stage definitions and written assumptions usually do more than a better model.
Where DemandSense fits. The DemandSense MCP server lets Claude or ChatGPT query LinkedIn ad engagement, identified site visitors and CRM state side by side, and anyone on the DemandSense trial can use it. A question you can ask it: “Which ICP-fit companies saw our ads, visited the site, and aren’t in our CRM yet?” The answer is a list of accounts to weigh in your model, so it’s a question about the forecast’s inputs, and the forecast is still built in your CRM or spreadsheet. Here’s how to analyze LinkedIn ads with Claude that way.
B2B Revenue Forecasting Tools for LinkedIn, Marketing, and Account Data
Forecasting tools differ by where they start. Some start from deals and rep activity; others start from marketing and account engagement, before there’s a deal.
| Tool | Best For | CRM & Marketing Data | Account Signals | AI & Forecasting Capabilities | Key Limitation |
|---|---|---|---|---|---|
| DemandSense | B2B teams running LinkedIn Ads who want an early read on which accounts are turning into pipeline | Paid and organic LinkedIn engagement, identified site visitors, and HubSpot, Salesforce or Attio pipeline | Engagement thresholds you set (Awareness, Engagement, Intent), Rising Accounts, Opportunity Gap, per-account journeys | No forecast model; the MCP server lets Claude or ChatGPT query ad engagement, site visitors and CRM state | Doesn’t produce the forecast; supplies the pre-pipeline inputs to the model you run in your CRM or forecasting tool |
| HockeyStack | Teams that want marketing, product and sales data feeding one revenue view | CRM, marketing automation, ad platforms, website and product usage | Behavior and fit scores per account | Behavior-based forecasting from correlations in your data; AI assistant Odin | The forecast rests on correlations in your own history, so thin history gives it little to work with |
| Factors.ai | Teams that want to see which companies and people are engaging, with intent | Website behavior, ad interactions, content consumption, third-party intent and CRM | Engagement and intent scores per account; account lists pushed to LinkedIn and Meta as matched audiences | AI copilot Scout; first-touch, last-touch and influenced attribution | Built around account scoring and attribution, not a revenue model for your next-quarter number |
| Clari Forecast | Executive and RevOps teams that own the forecast | Historical deal data and live rep and deal activity from the CRM and seller workflow | Deal-level risk signals on open pipeline | AI Forecast Agent, pipeline-risk flagging, plain-language questions about revenue data | Starts from deals and rep activity, so engagement before an opportunity exists isn’t its starting point |
| Gong Forecast | Teams that forecast from customer conversations alongside CRM deals | Calls, emails and other customer interactions, plus CRM deal data | Signals from customer conversations on open deals | AI Revenue Predictor, AI Deal Reviewer, risk identification, forecast tracking | Starts from interactions on deals, so accounts with no sales conversations yet fall outside its starting data |
What each tool is built for:
- DemandSense is a platform for the marketer who runs LinkedIn Ads in a small B2B team. It puts three things in one place that usually live in three separate tools: attribution, optimization, and website visitor profiling. On top of that sits an MCP server. DemandSense leaves the forecast itself to your CRM, spreadsheet or forecasting tool.
- HockeyStack is built for teams that want marketing, product and sales data in one revenue view. It reads the CRM, marketing automation, ad platforms, the website and product usage, scores accounts on behavior and fit, and forecasts from correlations between marketing activity, product usage and revenue. Its AI assistant is called Odin.
- Factors.ai is built for seeing which companies and people are engaging. It reads website behavior, ad interactions, content consumption, third-party intent and CRM data, scores accounts on engagement and intent, and pushes account lists to LinkedIn and Meta. Its AI copilot is called Scout.
- Clari Forecast is built for the team that owns the forecast for an executive audience. It uses historical deal data and live rep and deal activity, with an AI Forecast Agent and pipeline-risk flagging. Clari merged with Salesloft in December 2025.
- Gong Forecast is built for teams that forecast from customer conversations. It reads calls, emails and other interactions alongside CRM deal data, and offers an AI Revenue Predictor, an AI Deal Reviewer, risk identification and forecast tracking.
How to Choose a B2B Revenue Forecasting Tool That Uses LinkedIn and Account Signals
Questions to ask when you compare tools:
- CRM integration: does it read your CRM natively?
- LinkedIn and marketing data: does it see ad engagement per account, or only clicks and form fills?
- Account-level signals: can it show engagement before an opportunity exists?
- AI capabilities: can you ask questions of the data, and can you check the answer?
- Forecasting approach: deal-based, driver-based or predictive?
- Scenario modelling: can you change a driver and see the result?
- Forecast vs. actual reporting: does it show where the forecast was wrong?
In practice, tools get added in stages. Most teams start with the forecasting built into Salesforce or HubSpot, add a deal-level tool as the sales team grows, and add account signals when the question becomes what next quarter’s pipeline will look like. If the forecast problem is rep commits and deal risk, that’s what deal-level forecasting tools are built for. If it’s pipeline that doesn’t exist yet, that’s where account-based intelligence comes in.
DemandSense reads paid and organic LinkedIn engagement per account and HubSpot, Salesforce or Attio natively, and its Opportunity Gap shows engaged accounts with no CRM record yet. The forecast itself still runs in your CRM or forecasting tool. You can try DemandSense on your own campaigns free for 30 days at demandsense.com, no card needed.
How DemandSense Supplies the Account Signals Behind a B2B Revenue Forecast
The accounts that will become next quarter’s opportunities are already engaging with your LinkedIn ads and visiting your site, and none of that activity is in a forecast that starts at the opportunity. Here is how DemandSense covers that earlier part:
- DemandSense reads the activity. DemandSense reads paid and organic LinkedIn engagement per account, identified site visitors and CRM pipeline, side by side. Website visitor identification runs through a Google Tag Manager tag, and DemandSense scores each identified visitor against your ICP with rules you write (website visitors only, not CRM leads).
- DemandSense turns that activity into signals a forecast can use. You set the engagement thresholds, with the Awareness, Engagement and Intent presets or your own. Rising Accounts lists the accounts whose engagement is climbing this week, and Opportunity Gap lists the accounts with strong ad engagement and no CRM record. Both are panels you open in DemandSense when you review the forecast, not alerts.
- DemandSense shows what has worked before. Revenue Attribution in DemandSense shows which LinkedIn campaigns influenced pipeline and closed-won deals, with Won ROAS, over a 3-, 6- or 12-month lookback. That history is where your engaged-account-to-opportunity rate comes from.
- The forecast stays where it is. It lives in your CRM or forecasting tool. DemandSense gives that model the earlier inputs.
Try DemandSense free for 30 days at demandsense.com, no card needed.
FAQ
Monthly for most B2B teams, with a weekly check on the current-quarter pipeline. Update sooner when a driver moves sharply, such as a drop in win rate, a large deal slipping, or a spike in pipeline created.
Enough to cover a full year, so seasonality shows, and enough closed deals that win rates by stage hold steady from one period to the next. If stage rates swing wildly between periods, the history is still too thin to lean on.
Not deal by deal, but in aggregate, yes. Count the engaged ICP accounts and apply your own historical rate from engaged account to opportunity. That gives you an estimate of pipeline that doesn’t exist yet. Step 4 above walks through the sequence.
Yes, at account level. In our 2026 benchmark data the median LinkedIn CTR is 0.56%, so more than 99 in 100 impressions end without a click, which makes account engagement a better input than clicks or form fills. With LinkedIn’s CRM Sync, CRM data can take up to 72 hours to reach the Revenue Attribution Report, then 24 to 48 hours to show in Campaign Manager.
Compare the forecast with actual revenue for the period, by revenue stream, as a percentage difference. Then track that error over time and by driver, so you can see which assumption keeps missing. Don’t set an accuracy target until you have several months of results.
Forecast each opportunity once, in the CRM. Influenced revenue explains where pipeline came from; it isn’t extra revenue to add on top. Marketing signals adjust only the pipeline that doesn’t exist yet, and good attribution reporting keeps the two apart.
A forecast is what you expect to book, and a target is what you want to book. The gap between the two is the plan: the extra pipeline, conversion or deal size you need to close it.