
Summary: Average LinkedIn CPC Benchmarks at a Glance
The average LinkedIn CPC is $5.59 across B2B SaaS, IT and professional services, according to our 2026 LinkedIn B2B Benchmark Report. That average hides a skew: 75% of advertisers pay more than $6 per click, and only 12.5% pay under $3.
- A higher CPC than $5.59 isn’t necessarily bad. Most advertisers pay more.
- A lower CPC isn’t necessarily good. Cheap clicks from a broad audience often become leads that never buy.
- CPC measures what the auction charged you. Whether the click was worth it depends on what happened next.
What Is the LinkedIn Cost Per Click (CPC)?
Cost per click on LinkedIn is the amount you pay for each chargeable click on your ad. What counts as chargeable depends on your objective, ad format and bidding, and on where someone clicks.
For engagement campaigns, social actions like likes, comments, shares and follows count as chargeable clicks alongside clicks to your landing page. For website conversions, you only pay for clicks on your landing page link and CTA button.
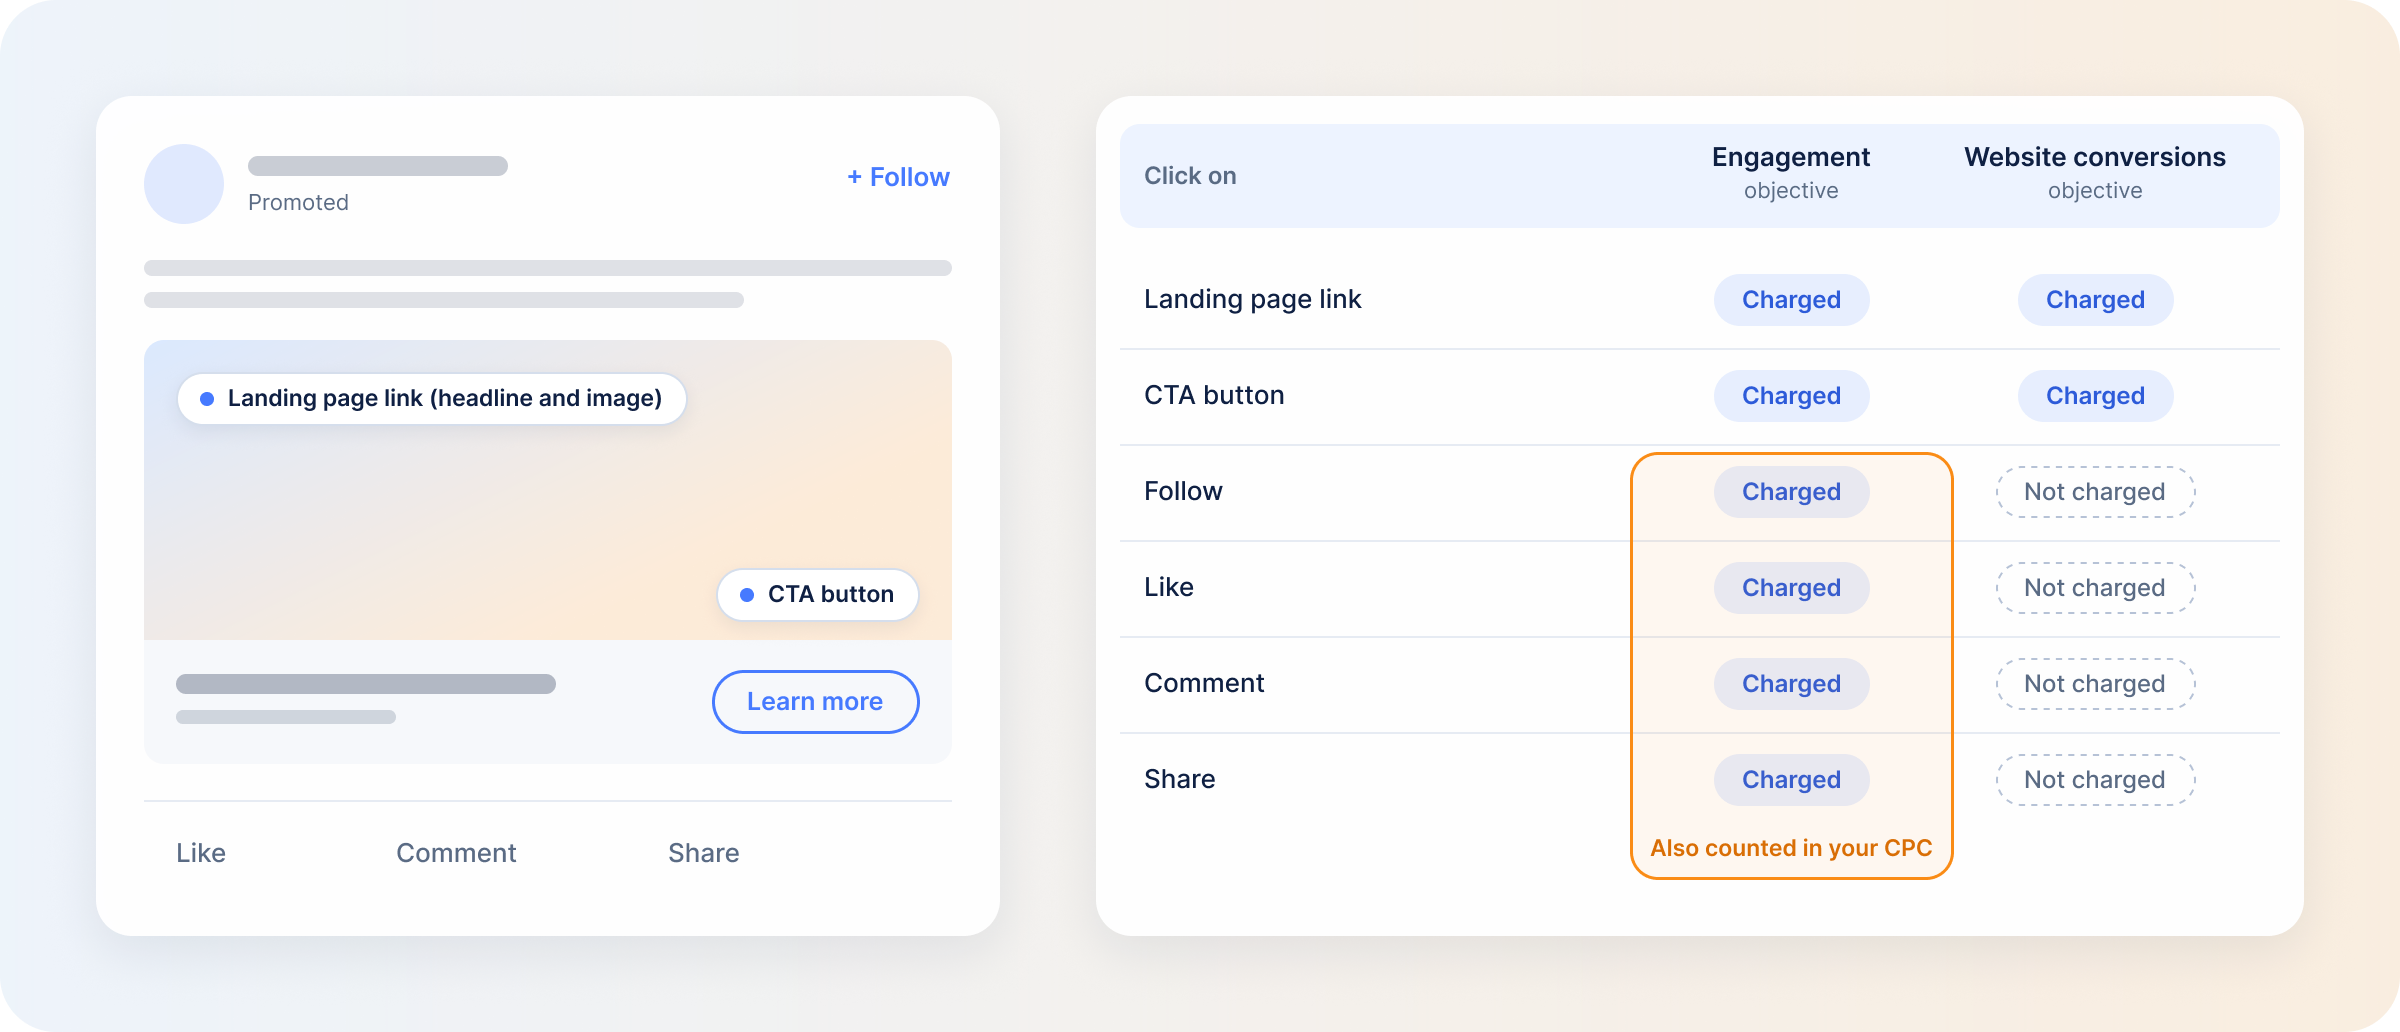
For most B2B campaigns, the clicks that matter are the ones to your landing page, because they tell you what your traffic really costs.
How Is LinkedIn CPC Calculated?
LinkedIn divides what you spent by your chargeable clicks:
CPC = Total ad spend ÷ Total chargeable clicks
The price comes out of an auction. LinkedIn weighs how relevant your ad is alongside your bid, which is why the same bid can produce a different CPC from one day to the next.
To see what your traffic costs, divide spend by landing page clicks instead of total clicks. If an engagement ad set shows a $5.59 CPC but only half of those clicks went to your landing page, your effective CPC for traffic is $11.18.
What Is the Average LinkedIn CPC in 2026?
Our 2026 LinkedIn B2B Benchmark Report puts the average CPC at $5.59 across B2B SaaS, IT and professional services. The distribution behind that average tells you more:
- 75% of LinkedIn advertisers pay more than $6 per click
- Only 12.5% pay less than $3
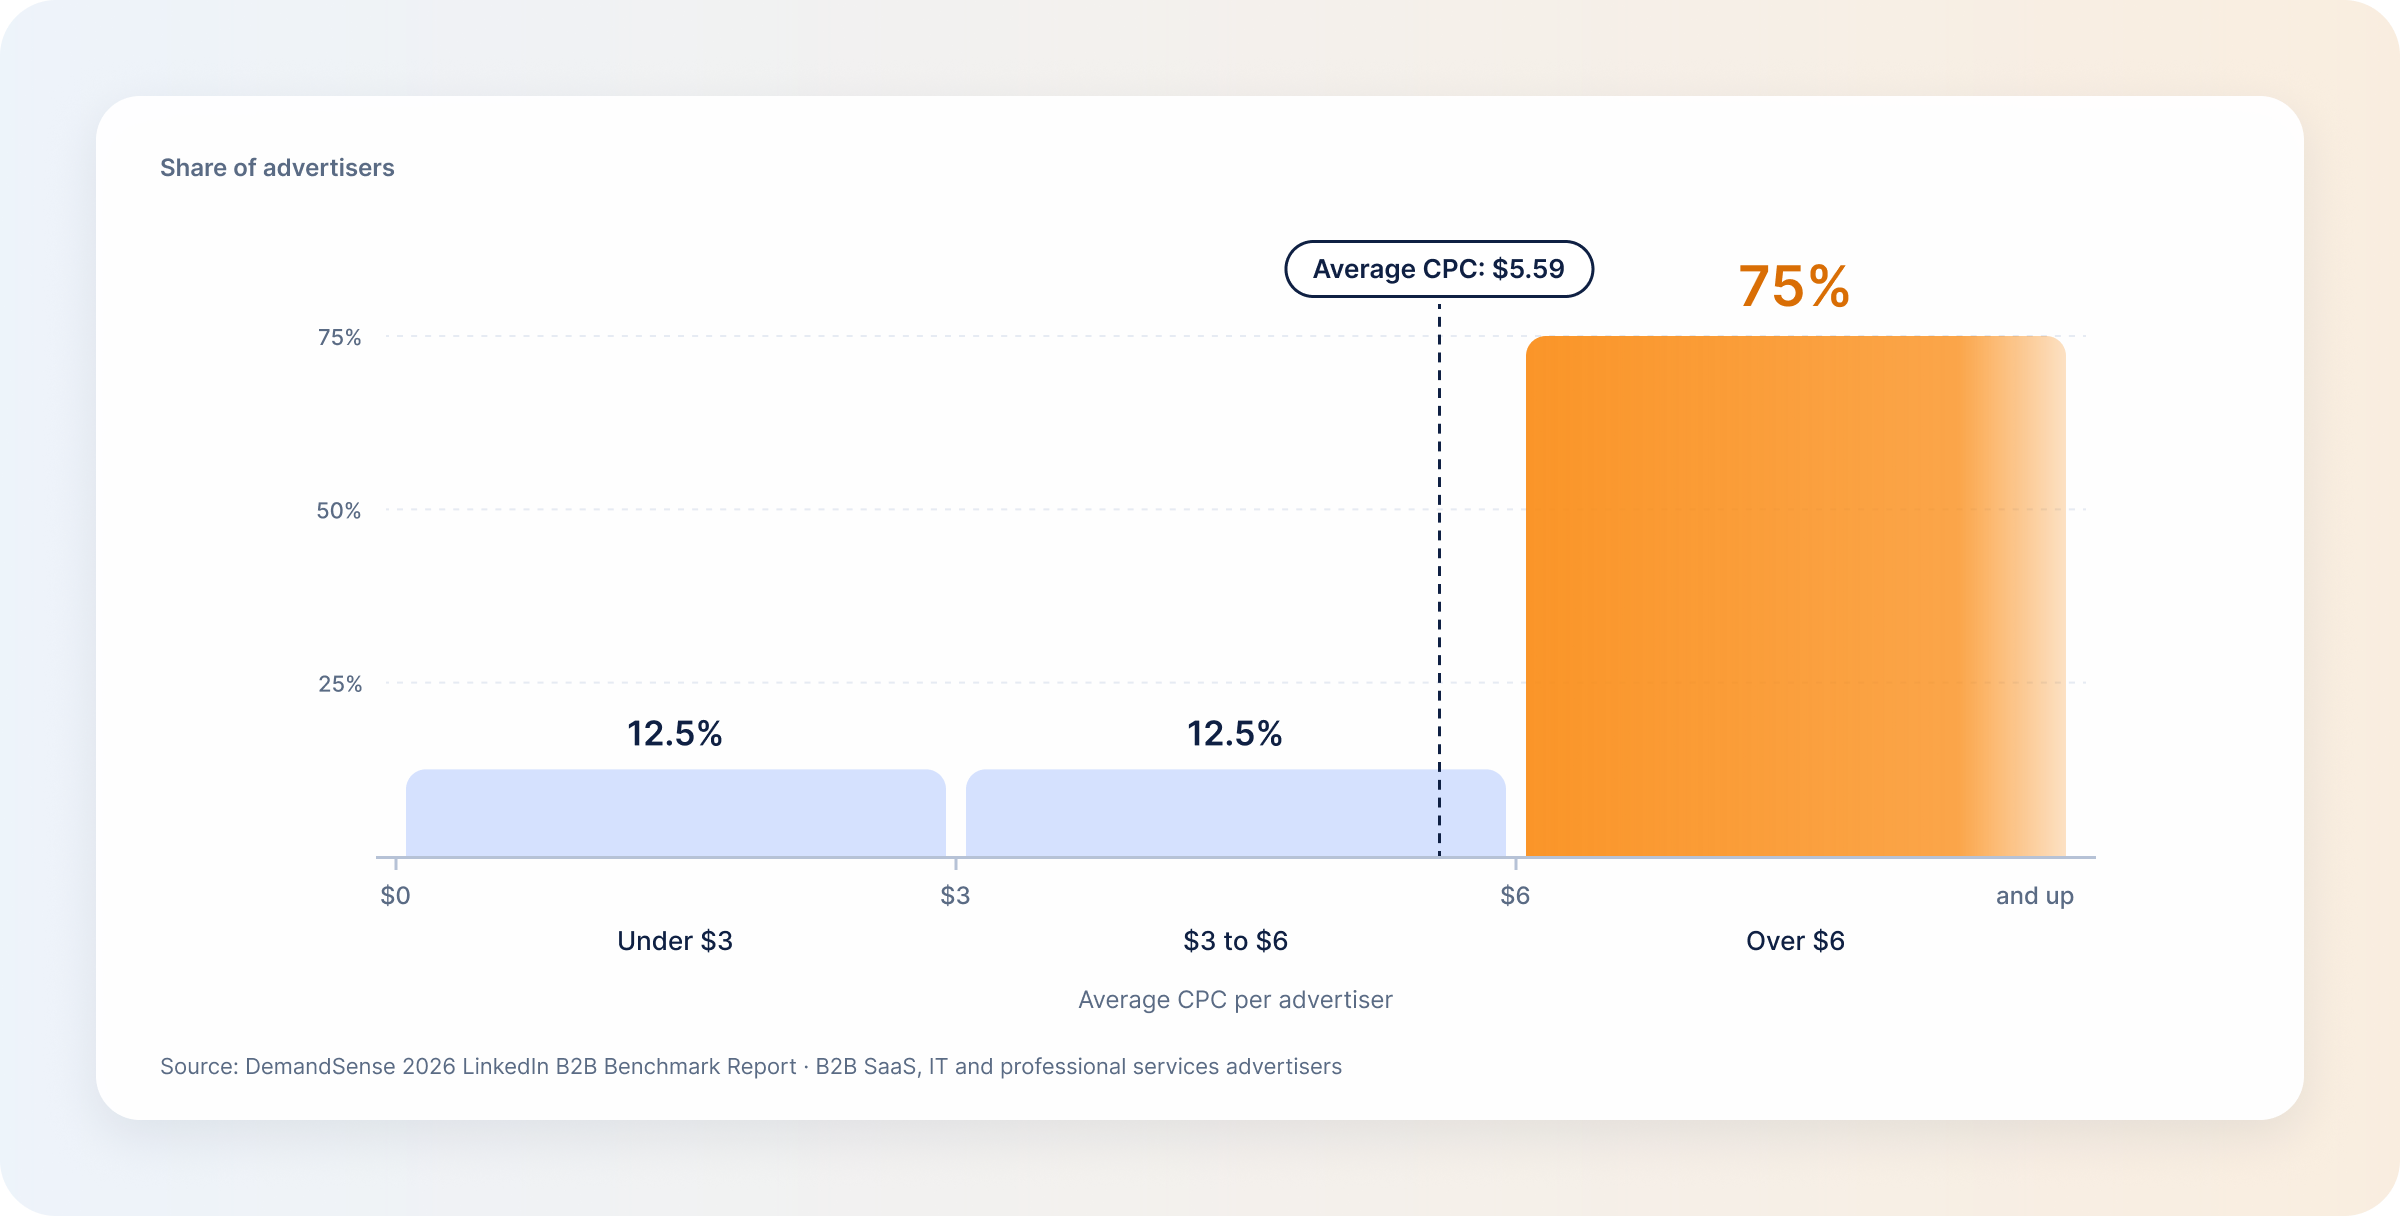
So the average understates what most advertisers pay. A smaller group of low-CPC advertisers pulls it down, while the typical advertiser sits above $6. Set a $5.59 target because it’s the average, and you’re aiming below where three in four advertisers land.
What Counts as a Good CPC on LinkedIn?
In B2B marketing, a good CPC depends on what the click is worth to you.
If you target a tight ICP list with large deal sizes, you’ll likely pay above average, because most advertisers in your category want the same people. That’s still a good CPC if those clicks turn into pipeline.
If your audience is broad, you’ll pay less per click, but more of those clicks come from people who will never buy, so each qualified lead costs more.
To judge your CPC, read it against what comes after the click: cost per lead, influenced pipeline, closed-won deals and return on ad spend.
LinkedIn CPC Benchmarks by Industry
CPC varies by industry, but our report doesn’t split it by sector, so we won’t put a number on each one. Three things drive the difference:
- Deal value. Categories where one closed deal is worth a lot, like B2B software, bid more for the same finite pool of decision-makers.
- Regulation. In regulated sectors such as healthcare and pharmaceuticals, fewer job titles qualify as buyers, so advertisers compete for a narrower pool.
- Seasonality. Demand moves whole categories at once. Costs typically rise in high-demand periods like Q4 and ease off in quieter months.
The same forces show up in CTR and CPM as well, which our LinkedIn ad benchmarks look at side by side.
LinkedIn CPC by Ad Format
Judging different ad formats by CPC can mislead, because they aren’t all billed on clicks. The objective and bidding strategy decide how a format is charged, so a Single Image ad on a website visits objective is billed differently from the same ad on brand awareness. How each format is billed:
| Ad Format | How It’s Billed | What to Benchmark It On |
|---|---|---|
| Single Image ads | CPC or CPM, depending on objective and bidding | CTR, landing page clicks, conversion rate |
| Video ads | Cost per view (CPV) on a video views objective; CPM or CPC on others | Video completion rate, average watch time |
| Document ads | CPC or CPM | Document completion rate, downloads |
| Thought Leader ads | Follows the objective you choose (CPM, CPC or CPV) | Engagement rate from target accounts, comments, shares |
| Dynamic ads and Text ads | CPC or CPM | CTR, follows, conversion rate |
| Message ads and Conversation ads | Cost per send (CPS) | Cost per engaged account, path completion rate |
That’s why a “CPC by format” comparison doesn’t hold up. Video on a video views objective is billed per view and Sponsored Messaging is billed per send, so putting their costs next to a Single Image ad’s CPC compares different things. Judge each format on the metric in the right-hand column instead.
What Factors Affect LinkedIn CPC?
Apart from industry and ad format, four factors move your CPC.
Audience Size, Seniority, Intent, and Competition
Small, senior audiences cost more because many B2B advertisers are after the same small pool of decision-makers. ABM account lists and high-intent retargeting audiences feel it most. Narrowing your targeting usually raises CPC, but it can still lower your cost per qualified lead.
Geography and Market Demand
Mature markets with a high concentration of decision-makers and corporate headquarters have more advertisers chasing the same people. Where buyers have bigger budgets, advertisers bid more to reach them.
CTR, Creative Relevance, and Ad Fatigue
CTR (click-through rate) is the first thing to check when your CPC climbs, because it signals relevance, and relevance feeds the auction. The average CTR for LinkedIn ads in our report is 0.52%, while DemandSense clients average 0.875% across campaigns. A higher CTR usually buys a lower CPC, and a low CTR does the opposite. Ad fatigue runs the loop backwards: as your audience tires of the same creative and ad copy, CTR drops and CPC rises.
Campaign Objective, Bidding, and Ad Delivery
Your objective decides what you’re charged for, so CPCs on an engagement ad set and a website visits ad set aren’t comparable. Maximum delivery is built to spend your full budget, which can push CPC up on a small audience. Cost cap holds your average cost per result near a target but can limit delivery, and manual bidding caps each bid.
How to Use LinkedIn CPC to Plan Your Ad Budget
CPC won’t tell you whether your campaigns are working, but it’s useful when planning your LinkedIn ads budget.
Start from your revenue goal and work backwards to the clicks you need to generate enough qualified leads. Then:
Required ad budget = Clicks needed × CPC
Use CPC data from your own recent campaigns if you have it, since it reflects your audience and offer.
Then check the result against LinkedIn’s minimum budget of $10 a day and $100 lifetime for a new campaign. At a $5.59 CPC, $10 a day buys fewer than two clicks, so a budget at the floor takes a long time to tell you anything.
CPC vs CPM vs CPL vs CPA: Read the Right Metric
CPC, CPM, CPL, and CPA all describe what your LinkedIn ads cost, but they measure different things:
| Metric | Formula | What It Measures | When to Use It |
|---|---|---|---|
| Cost per click (CPC) | Total ad spend ÷ total clicks | What you pay for each click | Website visits campaigns, when you’re buying traffic |
| Cost per mille (CPM) | (Total ad spend ÷ total impressions) × 1,000 | What you pay for every 1,000 impressions | Brand awareness campaigns |
| Cost per lead (CPL) | Total ad spend ÷ number of leads, or CPC ÷ conversion rate | What it costs to acquire a lead | Lead generation campaigns |
| Cost per acquisition (CPA) | Total ad spend ÷ total acquisitions | What you spend per acquisition (cost per conversion), such as a demo request or a closed deal | Website conversion campaigns, and judging campaign ROI |
A lower CPC doesn’t mean better performance. Cheap clicks from a broad audience often turn into expensive leads, and the cost only shows up further down the funnel. Our benchmark data has a clear example of the easy-looking route costing more. Native LinkedIn Lead Gen Forms pre-fill from the member’s profile and nobody has to leave the platform, yet the average LinkedIn CPL in our report is $810.83 for Lead Gen Forms, against $221.14 for an external landing page. That’s more than three times as much per lead.
So look at CPL and CPA before you optimize, especially for lead generation and website conversion campaigns. Cheap clicks look good on a dashboard, but they don’t count for much if they never turn into pipeline.
Common Mistakes That Inflate LinkedIn CPC
- Broadening the audience to get “cheaper clicks.” Audience Expansion and loose targeting can lower CPC while pulling in people outside your ICP, so cost per qualified lead goes up.
- Leaving campaigns running around the clock. Your budget keeps spending while your buyers are offline. Scheduling your ads around their working hours, by hand or with a tool, fixes that.
- Letting creative fatigue run on a finite account list. When the same accounts see the same ad too often, CTR drops and CPC rises. Watch frequency by account and refresh creative when CTR slides.
- Optimizing to the wrong objective. A website visits objective tells LinkedIn to find people likely to click, whether or not they’d buy. Match the objective to the conversion you want.
- Judging a campaign before it has enough clicks to read. Early swings are delivery still finding your audience. Wait until you can compare against your own history.
- Chasing CPC while cost per qualified lead climbs. The Lead Gen Form numbers above show how the easy-looking route can cost more per lead. Judge changes on lead quality, CPL and influenced pipeline.
How to Benchmark LinkedIn CPC for Your Own Campaigns
Most benchmarks marketers use are industry averages. Treat them as a starting hypothesis, because they don’t know your audience, offer or deal size.
Benchmark in this order:
- Your own account first. Compare like with like: same audience, same ad format, same objective, same quarter.
- Your category next. Check whether your costs make sense for your market and how competitive it is.
- A published platform average last, to see roughly where you stand.
Before you use any benchmark, look at what’s behind it. If the data comes mostly from enterprise teams targeting healthcare and you sell B2B SaaS to mid-market companies, it doesn’t describe your campaigns. The same goes when the objective, audience size, ad format or season differs from yours.
How DemandSense Connects LinkedIn CPC to Campaign Performance
In Campaign Manager, CPC stops at the click. It doesn’t show whether the accounts behind those clicks fit your ICP, or whether any of them became a deal.
DemandSense adds that context. The Hourly Breakdown shows when your audience is active, and ad scheduling moves spend away from the hours that don’t perform; in our own test, business-hours delivery raised CTR and brought CPC down slightly. You can see every job title and company your budget reaches and cut the ones inflating your costs, cap how often any one company sees your ads, and stop spending on accounts that already closed.
Then you can check whether the clicks were worth buying. DemandSense reads your LinkedIn engagement alongside deals in HubSpot, Salesforce or Attio, and Won ROAS shows the revenue from won deals against the spend behind them.
Try DemandSense on your own LinkedIn account, free for 30 days — no card needed.
Frequently Asked Questions
How Much Data Do You Need Before Evaluating LinkedIn CPC?
You need more than a handful of clicks over a few days. Early on, delivery is still finding your audience, so CPC swings say little about your campaign’s economics. Wait until you can compare against your own past campaigns.
Should LinkedIn CPC Be Benchmarked by Average or Median?
Read the distribution rather than either one on its own. Our report publishes an average CPC of $5.59 and no median, but 75% of advertisers pay over $6 and only 12.5% pay under $3, so most pay more than the average suggests. For your own campaigns, your historical CPC is the better benchmark.
Why Does LinkedIn CPC Change Over Time?
CPC changes because competition in the auction keeps moving. Budget cycles, end-of-quarter pushes and busy seasons bring more advertisers after the same decision-makers, so costs typically rise then. Creative fatigue and a saturated audience push CPC up too.
Why Is LinkedIn CPC Often Higher Than on Other Platforms?
With LinkedIn advertising you pay for targeting by job title, seniority and company, and for a smaller audience that more B2B advertisers compete for. Compare it with Google Ads or Meta on cost per qualified account.
Can Two Similar LinkedIn Campaigns Have Very Different CPCs?
Yes. Relevance, bidding and delivery timing all show up in that one number. Two ad sets aimed at overlapping audiences also go after the same members and end up competing for delivery.
How to Tell If Your LinkedIn CPC Is Actually Too High
Your CPC is too high when cost per qualified lead or per influenced account stops making sense for your deal sizes. Won ROAS, the revenue from won deals against spend, is the final check.
How to Lower LinkedIn CPC Without Sacrificing Lead Quality
Better creative is the most direct way of lowering your CPC. Then cut the hours when your buyers aren’t active, cap how often the same accounts see your ads, and trim the job titles and companies that click but never convert.
How to Plan a Budget Around LinkedIn CPC?
Work backwards from the leads you need, turn that into clicks, and multiply by your own CPC. Then check the total against the LinkedIn ads budget floor of $10 a day.